欢迎访问《中国农学通报》,

中国农学通报 ›› 2020, Vol. 36 ›› Issue (32): 118-122.doi: 10.11924/j.issn.1000-6850.casb20191100886

• 植物保护·农药 • 上一篇    下一篇

芋疫病空间分布格局及其抽样技术研究

王会福1(), 余山红1, 张惠琴2, 赵永彬1   

  1. 1台州市农业科学研究院,浙江临海 317000
    2仙居县植物保护检疫站,浙江仙居 317300
  • 收稿日期:2019-11-19 修回日期:2020-01-24 出版日期:2020-11-15 发布日期:2020-11-19
  • 作者简介:王会福,男,1970年出生,浙江临海人,正高级农艺师,硕士,主要从事植保技术研究和推广方面的工作。Tel:0576-85196587,E-mail: tznkywhf@126.com
  • 基金资助:
    浙江省台州市科技计划农业类项目“芋疫病灾变规律及绿色防控技术研究”(162ny05)

Taro Blight: Spatial Distribution Pattern and Sampling Technique

Wang Huifu1(), Yu Shanhong1, Zhang Huiqin2, Zhao Yongbin1   

  1. 1Taizhou Academy of Agricultural Sciences, Linhai Zhejiang 317000
    2Plant Protection and Quarantine Station of Xianju County, Xianju Zhejiang 317300
  • Received:2019-11-19 Revised:2020-01-24 Online:2020-11-15 Published:2020-11-19

摘要:

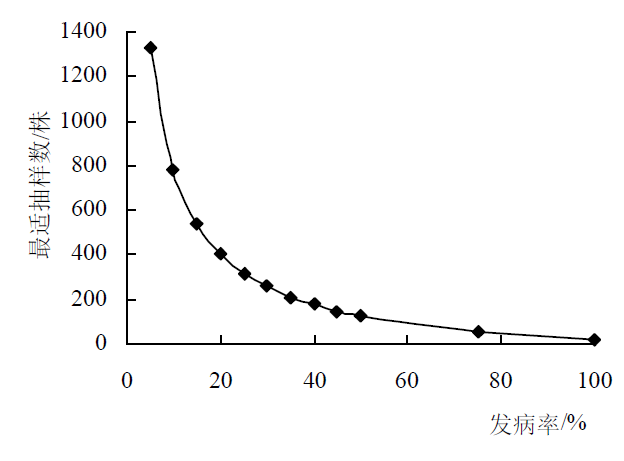
为了进一步提高对芋疫病预测预报,科学指导生产上的防治,应用最小二乘法、频次分布、聚集度指标、m*-m回归分析和Taylor幂法则等对病株的空间分布型进行了分析。结果表明:当田间芋疫病病株率在0.427~0.513时,病株田间分布属聚集分布;当田间芋疫病病株率在0.720~0.820时,病株田间分布属均匀分布。此外其病株空间分布的基本成分是个体群,病株个体间相互吸引,病株在大田中存在明显的发病中心,且病株个体的空间格局随着病株密度的提高越趋均匀分。在此基础上,提出了Iwao最适理论抽样模型N=232.3783/m-87.9438,并建立序贯抽样模型T0(N)=0.3689N±1.7177$\sqrt{N}$,即:调查株数N时,若累计病株率超过上界可定为防治对象田,若累计病株率未达到下界时,可定为不防治田,若累计病株率在上下界之间,则应继续调查,直到最大样本数m0=0.3689时,也即病株率15%,所需抽样数542株止。

关键词: 芋疫病, 空间分布型, 最适理论抽样模型, 序贯抽样模型, 抽样数

Abstract:

To further improve the prediction of taro disease, guide the disease prevention and control in production, the spatial distribution patterns of diseased plants were analyzed by least square method, frequency distribution, aggregation index, m*-M regression analysis and Taylor power law. The results showed that: when the disease rate of taro in field was 0.427-0.513, the distribution of disease plants in the field belonged to the aggregation distribution. When the disease rate of taro in field was 0.720-0.820, the disease plants were evenly distributed in field. In addition, the basic component of the diseased plants’ spatial distribution was the individual group, the diseased plants attracted each other, the diseased plants had obvious disease centers in field, and the spatial pattern of the diseased plants tended to be more uniform with the density increase of diseased plants. Based on this study, the Iwao optimal theoretical sampling model N = 232.3783/m-87.9438 was proposed, and the sequential sampling model T0(N) = 0.3689 N ± 1.7177$\sqrt{N}$ was established. That is to say, when investigating the number of N plants, if the cumulative disease rate exceeds the upper limit, it can be determined as the control object field. If the cumulative disease rate does not reach the lower limit, it can be defined as non control field. If the cumulative disease rate is between the upper and lower bounds, the investigation should be continued until the maximum sample number m0 = 0.3689, the disease rate is 15%, and the required sample number is 542.

Key words: taro disease, spatial distribution, the optimal theoretical sampling model, sequential sampling model, sampling number

中图分类号: