欢迎访问《中国农学通报》,

中国农学通报 ›› 2020, Vol. 36 ›› Issue (10): 114-121.doi: 10.11924/j.issn.1000-6850.casb18120061

所属专题: 农业气象

• 资源 环境 生态 土壤 气象 • 上一篇    下一篇

河西走廊东部强降温气候特征及预报方法研究

张金秀1(), 杨晓玲1,2(), 孙占峰1, 彭祥荣3   

  1. (1)甘肃省武威市气象局,甘肃武威 733099
    (2)中国气象局兰州干旱气象研究所,兰州 730020
    (3)甘肃省民勤县气象局,甘肃民勤 733300
  • 收稿日期:2018-12-16 修回日期:2019-03-18 出版日期:2020-04-05 发布日期:2020-03-19
  • 基金资助:
    国家自然基金“半干旱区春小麦农田干旱解除的降雨过程调控机制”(41775107);“气温升高和降水波动对半干旱区春小麦协同影响”(41305134)

Climatic Characteristics and Forecast Method of Strong Cooling in Eastern Hexi Corridor

Jinxiu Zhang1(), Xiaoling Yang1,2(), Zhanfeng Sun1, Xiangrong Peng3   

  1. (1)Wuwei Meteorological Bureau of Gansu Province, Wuwei Gansu 733099
    (2)Lanzhou Institute of Arid Meteorology CMA, Lanzhou 730020
    (3)Minqin Meteorological Bureau of Gansu Province, Minqin Gansu 733300
  • Received:2018-12-16 Revised:2019-03-18 Online:2020-04-05 Published:2020-03-19

摘要:

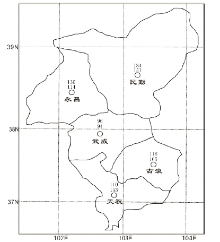
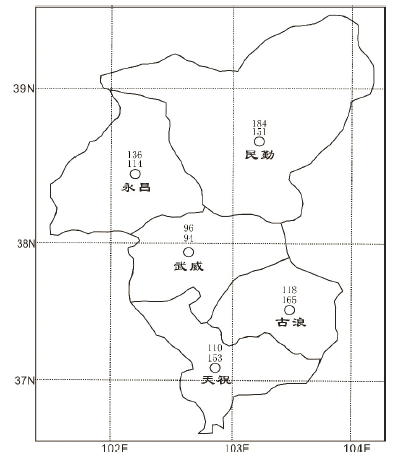
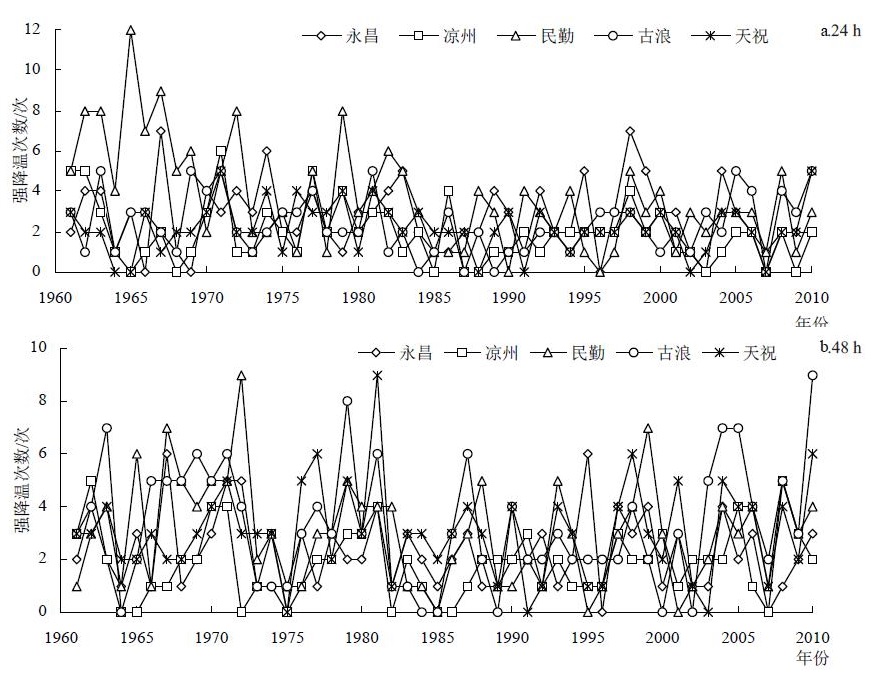
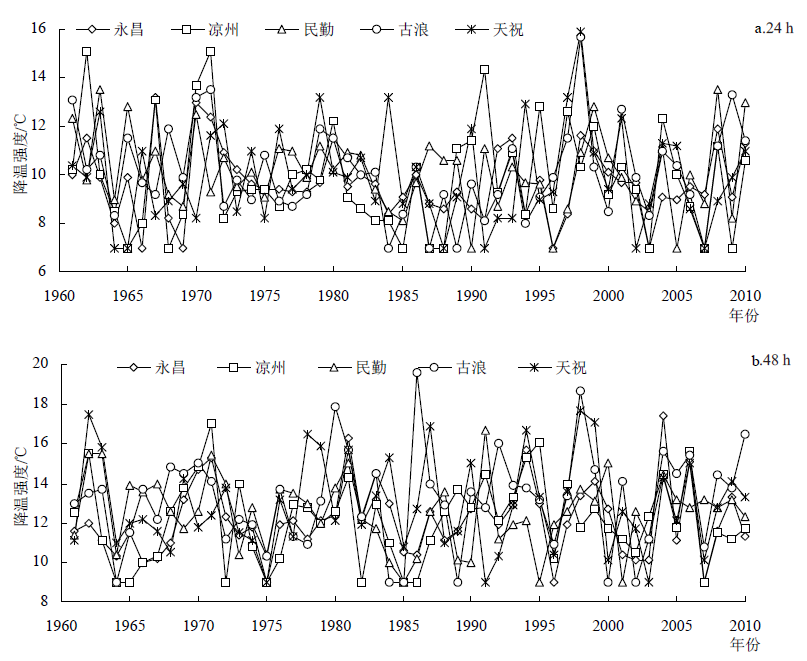
利用河西走廊东部1961—2010年5个气象站强降温资料[24 (48) h最低气温下降≥8 (10)℃、最低气温降至≤4℃],采用统计学方法系统分析了该区域强降温的时空分布、强度等气候特征,结果表明:河西走廊东部强降温次数海拔较高的山区和北部沙漠边缘明显多于绿洲平原区。年代、年强降温次数总体呈减少趋势,强降温主要发生在1—5月和9—12月,强降温次数4月最多。各强度强降温次数的变率较大,随着降温强度的增大,强降温次数迅速减少,24 h强降温强度总体呈弱减小趋势,48 h强降温强度总体呈弱增加趋势。利用2004—2013年1—5月和9—12月逐日20时ECMWF数值预报格点场资料,运用Press准则和逐步回归方法进行预报因子初选和因子精选,使用最优子集回归建立各地月最低气温预报方程,采用CSC双评分准则确定了全局最优的最低气温预报方程,预报方程通过了α=0.01显著性水平检验。采用最大靠近原则确定强降温预报的临界值和预报级别。预报拟合率24、48 h分别为80.0%~83.3%、81.3%~86.2%,预报准确率24、48 h分别为71.4%~75.0%、73.3%~77.1%,达到了较高的拟合和预报水平,可为强降温预报和预警提供客观有效的指导产品。

关键词: 强降温, 气候特征, ECMWF, 数值预报

Abstract:

Using strong cooling data [the lowest temperature decline rate of 24 (48) h was ≥8 (10)℃ and the lowest temperature was ≤4℃] of five meteorological stations in eastern Hexi corridor during 1961 to 2010, climatic characteristics of temporal and spatial distribution and intensity of strong cooling were analyzed systematically by statistical methods. The results showed that strong cooling times were more obvious in high elevation mountainous and northern desert edge than that in oasis plain area. Strong cooling times of age and year had an overall reducing tendency. Strong cooling weather occurred mainly from January to May and from September to December, mostly in April. The variable rate of strong cooling times of each strength was relatively large, and strong cooling times reduced rapidly with the cooling intensity increased. The strong cooling intensity of 24 h showed an overall weak reducing tendency, and that of 48 h showed a weak increasing tendency. Selecting ECMWF numerical forecast grid field data at 20:00 day by day from January to May and from September to December during 2004 to 2013, forecast factors were selected initially and precisely by Press criterion and stepwise regression method. The monthly lowest temperature forecast equations of each region were built with optimal subset regression, and the overall situation and optimal forecast equations were determined finally with the CSC double grading criterion. The forecast equations passed significance level examination of α=0.01. Forecast marginal value and forecast rank of strong cooling were determined with the biggest approaches principle. Forecast fitting rate of 24 and 48 h was 80.0%-83.3% and 81.3%-86.2%, respectively, and the forecast accuracy rate of 24 and 48 h was 71.4%-75.0% and 73.3%-77.1%, respectively, reaching high fitting and forecast level, and could provide objective and effective guiding products for strong cooling forecast and early warning.

Key words: strong cooling, climate characteristics, ECMWF, numerical forecast

中图分类号: