欢迎访问《中国农学通报》,
中国农学通报 ›› 2025, Vol. 41 ›› Issue (25): 126-133.doi: 10.11924/j.issn.1000-6850.casb2024-0803
秦治勇( ), 白智江, 杨再学()
收稿日期:2024-12-31
修回日期:2025-04-28
出版日期:2025-09-05
发布日期:2025-09-16
通讯作者:
作者简介:秦治勇,男,1976年出生,贵州余庆人,高级农艺师,大专,研究方向:植保技术推广。通信地址:564400 贵州省余庆县子营路194号 余庆县植保植检站,E-mail:987893625@qq.com。
基金资助:
QIN Zhiyong(), BAI Zhijiang, YANG Zaixue()
Received:2024-12-31
Revised:2025-04-28
Published:2025-09-05
Online:2025-09-16
摘要:
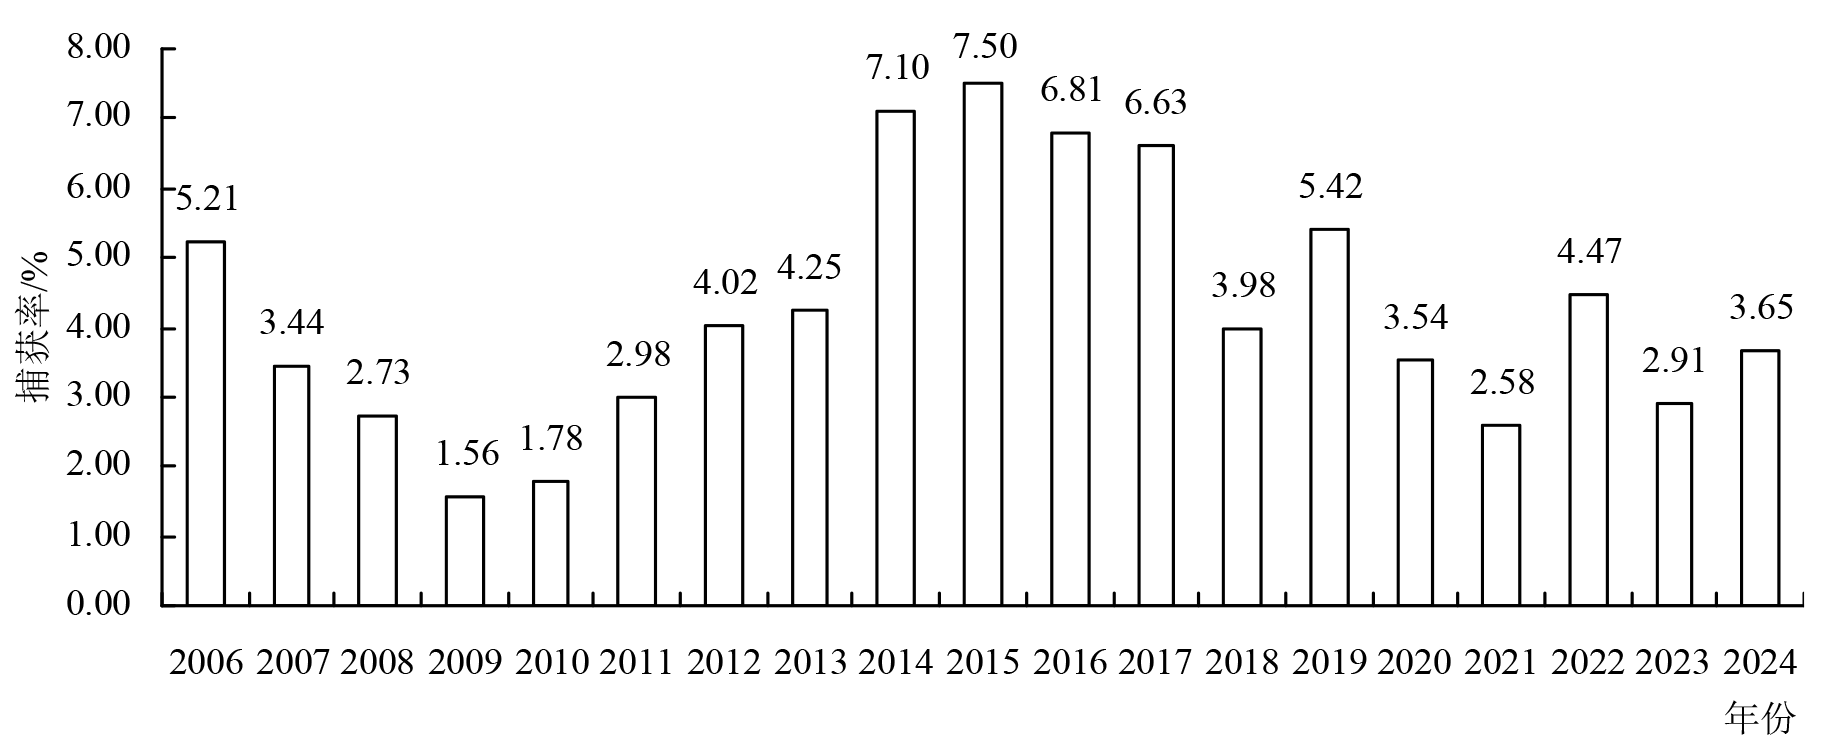
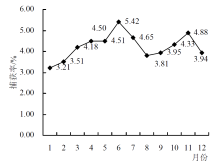
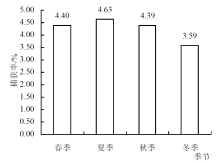
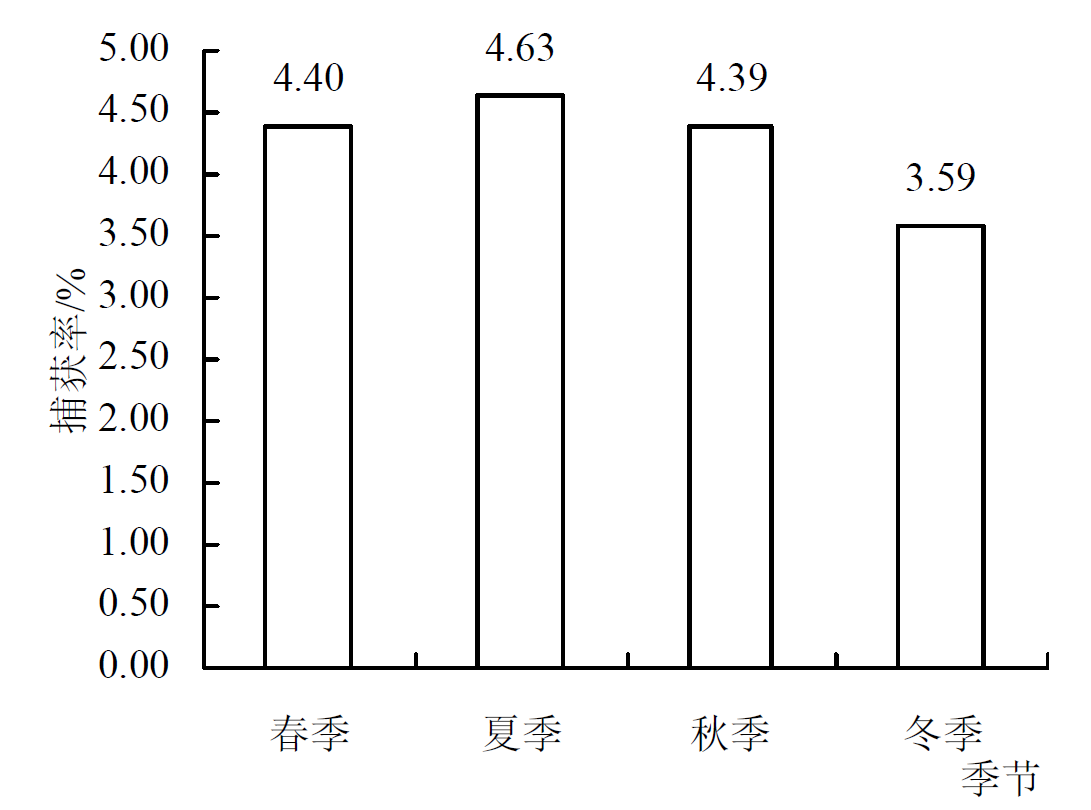
进一步摸清贵州省余庆县农田区害鼠优势种黑线姬鼠种群数量变化规律,为其种群数量预测预报及科学防控提供科学依据。对贵州省余庆县2006—2024年农田区害鼠优势种黑线姬鼠的种群数量监测数据进行分析研究。研究期间的19年共调查228次,农田区黑线姬鼠占总捕获鼠类的81.54%,为当地农田区害鼠优势种,多年平均捕获率为4.24%。每年的6、7月和10、11月出现2次种群数量高峰期,平均捕获率分别为5.42%、4.65%和4.33%、4.88%。不同年度种群数量差异极显著,不同月份种群数量差异显著,不同季节种群数量有差异但不显著。建立了黑线姬鼠2月和3月平均捕获率预测数量高峰(6月)种群数量预测预报模型(I1)Y=2.4687+0.7667X,可提前3个月预测6月种群数量,经回测验证,捕获率平均吻合率为90.55%;建立了黑线姬鼠7月捕获率预测数量高峰(11月)种群数量预测预报模型(I2)Y=2.3404+0.5471X,可提前4个月预测11月种群数量,经回测验证,捕获率平均吻合率为89.53%。研究摸清了农田区黑线姬鼠种群组成及种群数量变化规律,明确了春秋两季是农田区黑线姬鼠种群数量高峰期,黑线姬鼠是当地“鼠口夺粮”重点监测和防控的主要对象,建立了种群数量高峰预测预报模型,预测结果相对准确,易于操作和掌握,可以用于基层指导黑线姬鼠种群数量预测预报和防控工作。
秦治勇, 白智江, 杨再学. 农田区害鼠优势种黑线姬鼠种群数量变化规律及预测预报[J]. 中国农学通报, 2025, 41(25): 126-133.
QIN Zhiyong, BAI Zhijiang, YANG Zaixue. Population Change Law and Forecast of Dominant Rodent Species Apodemus agrarius in Farmland Area[J]. Chinese Agricultural Science Bulletin, 2025, 41(25): 126-133.
| 年份 | 置夹数/个 | 捕鼠数/只 | 平均捕获率/% | 黑线姬鼠 | 其他鼠类 | |||||||
|---|---|---|---|---|---|---|---|---|---|---|---|---|
| 数量/只 | 占比/% | 数量/只 | 占比/% | |||||||||
| 2006 | 4700 | 329 | 7.00 | 245 | 74.47 | 84 | 25.53 | |||||
| 2007 | 4800 | 219 | 4.56 | 165 | 75.34 | 54 | 24.66 | |||||
| 2008 | 4800 | 169 | 3.52 | 131 | 77.51 | 38 | 22.49 | |||||
| 2009 | 4800 | 110 | 2.29 | 75 | 68.18 | 35 | 31.82 | |||||
| 2010 | 4778 | 111 | 2.32 | 85 | 76.58 | 26 | 23.42 | |||||
| 2011 | 4800 | 177 | 3.69 | 143 | 80.79 | 34 | 19.21 | |||||
| 2012 | 4800 | 229 | 4.77 | 193 | 84.28 | 36 | 15.72 | |||||
| 2013 | 4800 | 248 | 5.17 | 204 | 82.26 | 44 | 17.74 | |||||
| 2014 | 4800 | 406 | 8.46 | 341 | 83.99 | 65 | 16.01 | |||||
| 2015 | 4800 | 402 | 8.38 | 360 | 89.55 | 42 | 10.45 | |||||
| 2016 | 4800 | 374 | 7.79 | 327 | 87.43 | 47 | 12.57 | |||||
| 2017 | 4800 | 343 | 7.15 | 318 | 92.71 | 25 | 7.29 | |||||
| 2018 | 4800 | 206 | 4.29 | 191 | 92.72 | 15 | 7.28 | |||||
| 2019 | 4800 | 289 | 6.02 | 260 | 89.97 | 29 | 10.03 | |||||
| 2020 | 4800 | 234 | 4.88 | 170 | 72.65 | 64 | 27.35 | |||||
| 2021 | 4800 | 192 | 4.00 | 124 | 64.58 | 68 | 35.42 | |||||
| 2022 | 5664 | 357 | 6.30 | 253 | 70.87 | 104 | 29.13 | |||||
| 2023 | 5160 | 177 | 3.43 | 150 | 84.75 | 27 | 15.25 | |||||
| 2024 | 4900 | 228 | 4.65 | 179 | 78.51 | 49 | 21.49 | |||||
| 合计 | 92402 | 4800 | 5.19 | 3914 | 81.54 | 886 | 18.46 | |||||

| 年份 | 1月 | 2月 | 3月 | 4月 | 5月 | 6月 | 7月 | 8月 | 9月 | 10月 | 11月 | 12月 | ||||||||||
|---|---|---|---|---|---|---|---|---|---|---|---|---|---|---|---|---|---|---|---|---|---|---|
| 2006 | 2.75 | 6.50 | 5.50 | 5.00 | 6.00 | 8.75 | 6.75 | 3.33 | 1.75 | 4.25 | 5.25 | 6.25 | ||||||||||
| 2007 | 2.50 | 3.50 | 4.25 | 3.75 | 4.75 | 7.00 | 3.75 | 1.25 | 2.00 | 1.00 | 3.50 | 4.00 | ||||||||||
| 2008 | 2.00 | 0.75 | 5.00 | 4.50 | 5.75 | 4.00 | 2.75 | 1.50 | 0.75 | 1.25 | 2.25 | 2.25 | ||||||||||
| 2009 | 1.75 | 1.50 | 1.00 | 2.00 | 2.25 | 1.50 | 1.25 | 1.50 | 0.25 | 2.75 | 1.50 | 1.50 | ||||||||||
| 2010 | 1.50 | 0.75 | 0.25 | 2.75 | 4.00 | 2.25 | 1.32 | 0.25 | 1.00 | 2.75 | 2.25 | 2.25 | ||||||||||
| 2011 | 1.00 | 0.50 | 2.75 | 4.25 | 4.50 | 2.50 | 3.75 | 0.50 | 1.00 | 1.75 | 5.50 | 7.75 | ||||||||||
| 2012 | 1.50 | 3.00 | 2.50 | 2.75 | 5.75 | 3.25 | 3.50 | 3.50 | 3.75 | 6.50 | 8.50 | 3.75 | ||||||||||
| 2013 | 0.75 | 2.00 | 4.50 | 2.50 | 4.75 | 8.75 | 6.50 | 2.50 | 2.50 | 6.00 | 6.25 | 4.00 | ||||||||||
| 2014 | 6.25 | 3.00 | 5.00 | 7.75 | 6.25 | 8.50 | 9.50 | 5.25 | 6.50 | 10.25 | 9.50 | 7.50 | ||||||||||
| 2015 | 4.50 | 6.75 | 10.00 | 11.75 | 6.75 | 7.75 | 6.50 | 10.25 | 9.00 | 6.50 | 5.50 | 4.75 | ||||||||||
| 2016 | 6.75 | 6.00 | 6.75 | 5.50 | 6.25 | 7.50 | 6.25 | 9.25 | 10.00 | 6.50 | 7.00 | 4.00 | ||||||||||
| 2017 | 4.50 | 4.25 | 7.25 | 6.00 | 6.75 | 4.50 | 9.75 | 8.00 | 10.00 | 8.00 | 4.75 | 5.75 | ||||||||||
| 2018 | 4.25 | 5.50 | 4.00 | 2.00 | 3.00 | 5.25 | 0.50 | 2.75 | 1.25 | 5.50 | 5.75 | 8.00 | ||||||||||
| 2019 | 5.25 | 6.75 | 1.75 | 2.25 | 1.50 | 6.00 | 8.75 | 3.75 | 8.75 | 5.25 | 10.75 | 4.25 | ||||||||||
| 2020 | 4.50 | 5.00 | 5.50 | 4.25 | 2.50 | 4.25 | 1.50 | 3.75 | 5.00 | 3.00 | 2.00 | 1.25 | ||||||||||
| 2021 | 0.50 | 2.00 | 2.25 | 4.00 | 2.50 | 3.00 | 2.00 | 2.00 | 1.75 | 4.00 | 4.25 | 2.75 | ||||||||||
| 2022 | 4.00 | 5.00 | 3.25 | 6.75 | 5.75 | 6.50 | 6.69 | 4.39 | 3.96 | 1.75 | 2.50 | 2.25 | ||||||||||
| 2023 | 4.25 | 1.50 | 5.00 | 3.75 | 2.60 | 4.50 | 3.25 | 2.75 | 2.50 | 2.50 | 2.50 | 1.29 | ||||||||||
| 2024 | 2.50 | 2.50 | 3.00 | 4.00 | 4.00 | 7.25 | 4.00 | 6.00 | 3.25 | 2.75 | 3.25 | 1.25 | ||||||||||
| 平均 | 3.21 | 3.51 | 4.18 | 4.50 | 4.51 | 5.42 | 4.65 | 3.81 | 3.95 | 4.33 | 4.88 | 3.94 | ||||||||||
| SD | 1.82 | 2.10 | 2.27 | 2.31 | 1.65 | 2.28 | 2.81 | 2.76 | 3.21 | 2.45 | 2.58 | 2.18 | ||||||||||

| 年度 | 2月和3月平均捕获率/% | 预测值 | 实测值 | 吻合率 | |||||||||
|---|---|---|---|---|---|---|---|---|---|---|---|---|---|
| 捕获率(±置信限)/% | 发生程度 | 捕获率/% | 发生程度 | 捕获率/% | 对发生程度判定 | ||||||||
| 2006 | 6.00 | 7.07±1.36 | 3 | 8.75 | 3 | 96.29 | √ | ||||||
| 2007 | 3.88 | 5.44±0.90 | 3 | 7.00 | 3 | 90.57 | √ | ||||||
| 2008 | 2.88 | 4.68±1.01 | 2-[3] | 4.00 | 2 | 100.00 | √ | ||||||
| 2009 | 1.25 | 3.43±1.52 | 1-[2] | 1.50 | 1 | 73.06 | √ | ||||||
| 2010 | 0.50 | 2.85±1.82 | 1-[2] | 2.25 | 1 | 100.00 | √ | ||||||
| 2011 | 1.63 | 3.72±1.38 | 2 | 2.50 | 1 | 100.00 | × | ||||||
| 2012 | 2.75 | 4.58±1.04 | 2-[3] | 3.25 | 2 | 91.07 | √ | ||||||
| 2013 | 3.25 | 4.96±0.94 | 2-[3] | 8.75 | 3 | 67.44 | √ | ||||||
| 2014 | 4.00 | 5.54±0.90 | 3 | 8.50 | 3 | 75.70 | √ | ||||||
| 2015 | 8.38 | 8.89±2.32 | 3-[4] | 7.75 | 3 | 100.00 | √ | ||||||
| 2016 | 6.38 | 7.36±1.50 | 3 | 7.50 | 3 | 100.00 | √ | ||||||
| 2017 | 5.75 | 6.88±1.27 | 3 | 4.50 | 2 | 75.39 | × | ||||||
| 2018 | 4.75 | 6.11±0.99 | 3 | 5.25 | 3 | 100.00 | √ | ||||||
| 2019 | 4.25 | 5.73±0.92 | 3 | 6.00 | 3 | 100.00 | √ | ||||||
| 2020 | 5.25 | 6.49±1.11 | 3 | 4.25 | 2 | 73.43 | × | ||||||
| 2021 | 2.13 | 4.10±1.21 | 2 | 3.00 | 1 | 100.00 | × | ||||||
| 2022 | 4.13 | 5.64±0.91 | 3 | 6.50 | 3 | 100.00 | √ | ||||||
| 2023 | 3.25 | 4.96±0.94 | 2-[3] | 4.50 | 2 | 100.00 | √ | ||||||
| 2024 | 2.75 | 4.58±1.04 | 2-[3] | 7.25 | 3 | 77.43 | √ | ||||||
| 平均 | 3.85 | 5.19±1.21 | 3 | 5.42 | 3 | 90.55 | |||||||
| 年度 | 7月捕获率/% | 预测值 | 实测值 | 吻合率 | |||||||||
|---|---|---|---|---|---|---|---|---|---|---|---|---|---|
| 捕获率(±置信限)/% | 发生程度 | 捕获率/% | 发生程度 | 捕获率/% | 对发生程度判定 | ||||||||
| 2006 | 6.75 | 6.03±1.53 | 3 | 5.25 | 3 | 100.00 | √ | ||||||
| 2007 | 3.75 | 4.39±1.06 | 2 | 3.50 | 2 | 100.00 | √ | ||||||
| 2008 | 2.75 | 3.84±1.14 | 2 | 2.25 | 1 | 79.81 | × | ||||||
| 2009 | 1.25 | 3.02±1.45 | 2-[1] | 1.50 | 2 | 94.85 | √ | ||||||
| 2010 | 1.32 | 3.06±1.43 | 2-[1] | 2.25 | 1 | 100.00 | √ | ||||||
| 2011 | 3.75 | 4.39±1.06 | 2 | 5.50 | 3 | 99.17 | × | ||||||
| 2012 | 3.50 | 4.26±1.07 | 2 | 8.50 | 3 | 62.65 | × | ||||||
| 2013 | 6.50 | 5.90±1.46 | 3 | 6.25 | 3 | 100.00 | √ | ||||||
| 2014 | 9.50 | 7.54±2.39 | 3 | 9.50 | 3 | 100.00 | √ | ||||||
| 2015 | 6.50 | 5.90±1.46 | 3 | 5.50 | 3 | 100.00 | √ | ||||||
| 2016 | 6.25 | 5.76±1.40 | 3 | 7.00 | 3 | 100.00 | √ | ||||||
| 2017 | 9.75 | 7.68±2.47 | 3 | 4.75 | 2 | 90.44 | × | ||||||
| 2018 | 0.50 | 2.61±1.65 | 1 | 5.75 | 3 | 74.19 | × | ||||||
| 2019 | 8.75 | 7.13±2.14 | 3 | 10.75 | 4 | 86.17 | × | ||||||
| 2020 | 1.50 | 3.16±1.38 | 2-[1] | 2.00 | 1 | 100.00 | √ | ||||||
| 2021 | 2.00 | 3.43±1.27 | 2 | 4.25 | 2 | 100.00 | √ | ||||||
| 2022 | 6.69 | 6.00±1.51 | 3 | 2.50 | 1 | 20.40 | × | ||||||
| 2023 | 3.25 | 4.12±1.09 | 2 | 2.50 | 1 | 100.00 | × | ||||||
| 2024 | 4.00 | 4.53±1.06 | 2 | 3.25 | 2 | 93.38 | √ | ||||||
| 平均 | 4.65 | 4.88±1.47 | 2-[3] | 4.88 | 2 | 89.53 | |||||||
| [1] |
杨再学. 中国黑线姬鼠及其防治对策[M]. 贵州: 贵州科技出版社, 2009.
|
| [2] |
陈卫, 高武, 傅必谦. 北京兽类志[M]. 北京: 北京出版社, 2001.
|
| [3] |
杨再学, 雷强, 谈孝凤, 等. 2017—2022年贵州省农区鼠类群落组成及种群数量变化规律[J]. 中国植保导刊, 2023, 43(12):37-41.
|
| [4] |
杨再学, 郑元利, 郭仕平, 等. 黑线姬鼠种群数量动态及预测预报模型研究[J]. 中国农学通报, 2007, 23(2):193-197.
|
| [5] |
谭向红, 蒋光藻, 倪健英. 黑线姬鼠种群特征及数量变动规律研究[J]. 西南农业学报, 1991, 4(4):80-83.
|
| [6] |
李容, 刘自远, 刘成福, 等. 四川省开江县黑线姬鼠种群动态及繁殖生态研究[J]. 医学动物防制, 2009, 25(5):321-323.
|
| [7] |
王勇, 陈安国. 洞庭湖稻区黑线姬鼠种群数量预测[J]. 兽类学报, 1997, 17(2):125-130.
|
| [8] |
王华弟. 农田黑线姬鼠发生规律与防治技术[J]. 植物保护学报, 1998, 25(2):181-186.
|
| [9] |
蔡美艳, 陈海波. 温岭市农田黑线姬鼠种群数量动态研究[J]. 基层农技推广, 2020, 8(7):42-44.
|
| [10] |
王华. 奉贤区害鼠优势种黑线姬鼠的发生规律及防控技术[J]. 上海农业科技, 2024(3):137-139.
|
| [11] |
侯祥, 韩宁, 封托, 等. 气候因素对黑线姬鼠种群动态影响的非线性效应[J]. 生态学报, 2020, 40(14):4836-4841.
|
| [12] |
文炳智, 杨再学. 雷山县黑线姬鼠种群数量动态及繁殖参数变化[J]. 山地农业生物学报, 2012, 31(1):44-49.
|
| [13] |
李恩涛, 周全忠, 李跃辉, 等. 瓮安县黑线姬鼠种群数量变化规律[J]. 江西农业学报, 2013, 25(10):93-95.
|
| [14] |
赵芳, 龙兴贵, 杨再学, 等. 黔西北地区农田黑线姬鼠种群数量动态及繁殖特征变化[J]. 亚热带农业研究, 2015, 11(1):46-50.
|
| [15] |
潘世昌, 李梅. 息烽县农田黑线姬鼠种群数量的发生动态[J]. 贵州农业科学, 2016, 44(10):43-45.
|
| [16] |
刘毅, 杨通武, 李贵发, 等. 凯里市黑线姬鼠种群数量动态分析[J]. 中国农学通报, 2023, 40(2):131-136.
|
| [17] |
杨再学, 金星, 郭永旺, 等. 贵州省不同地区黑线姬鼠种群数量动态分析[J]. 山地农业生物学报, 2015, 34(1):13-17.
|
| [18] |
尹文书, 杨再学. 贵州息烽农田黑线姬鼠种群最适温度与降雨区间分析[J]. 中国植保导刊, 2020, 40(8):35-39.
|
| [19] |
全国农业技术推广服务中心. NY/T 1481—2007,农区鼠害监测技术规范[S]. 北京: 中国标准出版社, 2008.
|
| [20] |
杨再学, 金星. 贵州农区鼠害监测与防治技术标准[M]. 贵州: 贵州科技出版社, 2013.
|
| [21] |
郭永旺, 靳光宇, 张振铎, 等. 吉林蛟河市主要农作物害鼠群落结构及其危害损失调查[J]. 中国植保导刊, 2012, 32(3):24-26.
|
| [22] |
柳付明, 陈秀英, 陈伟芝, 等. 丽水市鼠类物携带钩端螺旋体的研究[J]. 中国地方病防治, 2024, 39(5):434-435.
|
| [23] |
卢志宇, 闫鑫, 于永慧, 等. 江西省啮齿动物携带立克次体分子流行病学研究[J]. 中国人兽共患病学报, 2021, 37(7):578-585.
doi: 10.3969/j.issn.1002-2694.2021.00.096 |
| [24] |
陈智超, 高大维, 杨卫, 等. 六安市鼠形动物中5种病原体检测结果分析[J]. 中华卫生杀虫药械, 2024, 30(4):374-377.
|
| [25] |
杨再学, 郑元利, 金星, 等. 黑线姬鼠胎仔数变动规律及对种群数量的影响[J]. 中国农学通报, 2013, 29(33):363-367.
|
| [26] |
|
| [27] |
姜运良, 卢浩泉, 李玉春, 等. 山东阳谷县黑线仓鼠种群数量预测预报[J]. 兽类学报, 1994, 14(3):195-202.
|
| [1] | 肖卿艳, 张露, 阳祝红, 彭德良, 叶姗, 丁中. 拟禾本科根结线虫种群密度与旱稻产量损失的关系[J]. 中国农学通报, 2024, 40(27): 108-114. |
| [2] | 刘毅, 杨通武, 李贵发, 朱莲英. 凯里市黑线姬鼠种群数量动态分析[J]. 中国农学通报, 2024, 40(2): 131-136. |
| [3] | 廖珺, 方洪生, 苏有健, 王烨军, 张永利, 孙宇龙, 方雅各. 不同摊放环境下茶鲜叶失水的变化规律[J]. 中国农学通报, 2023, 39(4): 160-164. |
| [4] | 李梅, 徐加林, 尹文书, 敖成红, 宋致书, 杨再学. 息烽县黑线姬鼠形态特征及繁殖特征变化[J]. 中国农学通报, 2023, 39(35): 150-156. |
| [5] | 陶娟花, 石其伟, 伍少福, 章明奎. 浙东沿海涂地土壤结构演变特征及机理研究[J]. 中国农学通报, 2023, 39(18): 81-85. |
| [6] | 王子豪, 柳荦, 唐安琪, 买占海, 王金泉, 胡燕. 伊犁马长途运输应激血液生理、生化及激素指标的动态变化规律[J]. 中国农学通报, 2021, 37(5): 96-103. |
| [7] | 尹文书, 陈海燕, 李梅, 宋致书, 杨再学. 黔中地区气候变化对鼠类灾变规律的影响[J]. 中国农学通报, 2020, 36(36): 100-105. |
| [8] | 王霞, 袁旭东, 周洪艳, 张承伦, 彭杰, 彭建军, 邓亚平, 黄飘逸, 高红梅, 孙念. 重庆金佛山国家级自然保护区林麝(Moschus berezovskii)种群数量初步调查及地理分布[J]. 中国农学通报, 2020, 36(19): 44-47. |
| [9] | 李祥科,张洪芬. 黄土高原冬季日照时数对冬小麦发育期的影响[J]. 中国农学通报, 2019, 35(31): 72-75. |
| [10] | 张红妮,周忠文,车向军. 西峰黄土高原冬季平均气温对冬小麦发育期的影响分析[J]. 中国农学通报, 2019, 35(10): 95-98. |
| [11] | 石美娟,窦彦鑫,任哲斌,王芸芸,何美美,杨萍. 滴灌条件下富士苹果树茎流速率变化规律研究[J]. 中国农学通报, 2019, 35(10): 58-65. |
| [12] | 梅增霞,李建庆,张智涛. 危害白蜡树云斑天牛种群不同虫态的数量动态和频次比较[J]. 中国农学通报, 2017, 33(28): 142-145. |
| [13] | 梅增霞,李建庆,张智涛. 杨树云斑白条天牛不同虫态种群数量的增长规律及频次比较[J]. 中国农学通报, 2016, 32(24): 190-193. |
| [14] | 胡晓航,周建朝. 施肥对甜菜生长季中黑土氮素时空变异特征效应[J]. 中国农学通报, 2015, 31(31): 217-227. |
| [15] | 裘丽萍,李志波,宋超,张聪,郑尧,孙博,陈家长. 罗非鱼池塘养殖周期沉积物理化指标的变化规律研究[J]. 中国农学通报, 2015, 31(29): 23-27. |
| 阅读次数 | ||||||
|
全文 |
|
|||||
|
摘要 |
|
|||||