欢迎访问《中国农学通报》,
中国农学通报 ›› 2020, Vol. 36 ›› Issue (14): 80-87.doi: 10.11924/j.issn.1000-6850.casb19010034
所属专题: 玉米
孙洪仁1, 张吉萍2, 冮丽华3, 吕玉才4, 王应海5
收稿日期:2019-01-07
修回日期:2019-04-24
出版日期:2020-05-15
发布日期:2020-05-20
作者简介:孙洪仁,男,1965年出生,吉林怀德人,副教授,硕士,研究方向:牧草与作物水肥管理。通信地址:100193 北京市海淀区圆明园西路2号 中国农业大学草业科学与技术学院,Tel:010-62733083,E-mail: sunhongren@cau.edu.cn。
基金资助:Sun Hongren1, Zhang Jiping2, Gang Lihua3, Lv Yucai4, Wang Yinghai5
Received:2019-01-07
Revised:2019-04-24
Online:2020-05-15
Published:2020-05-20
摘要:
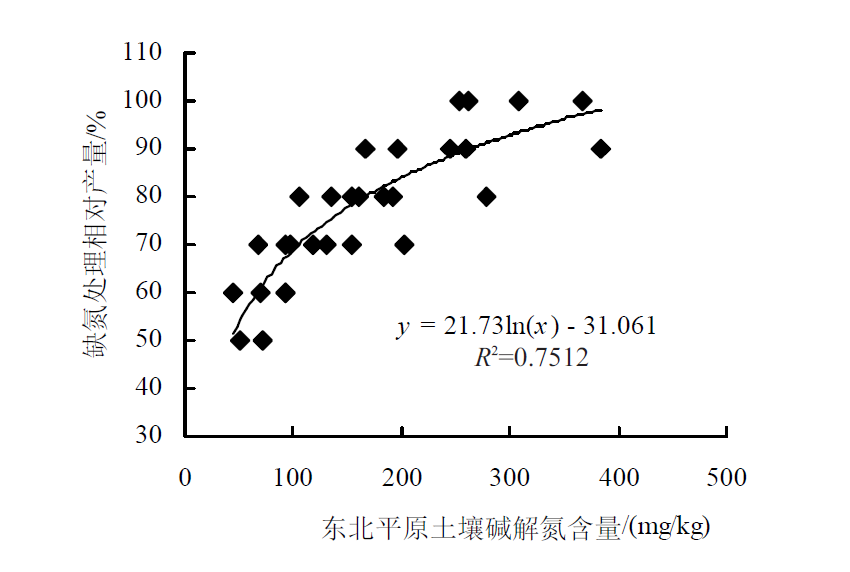
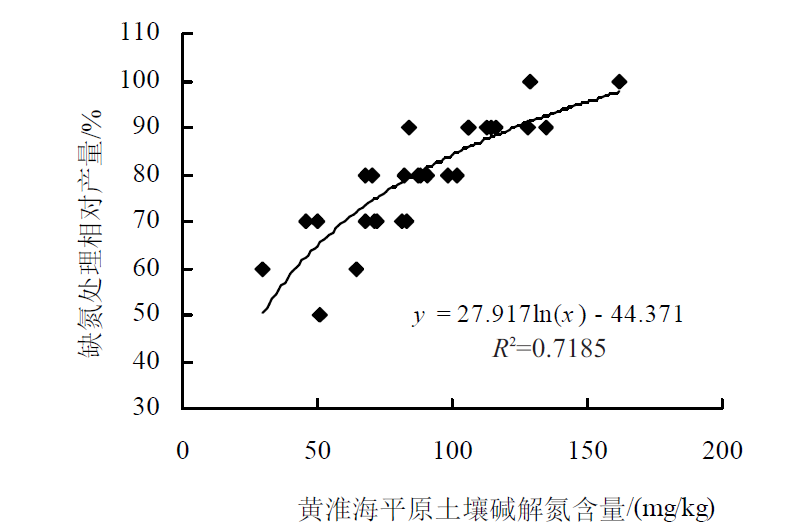
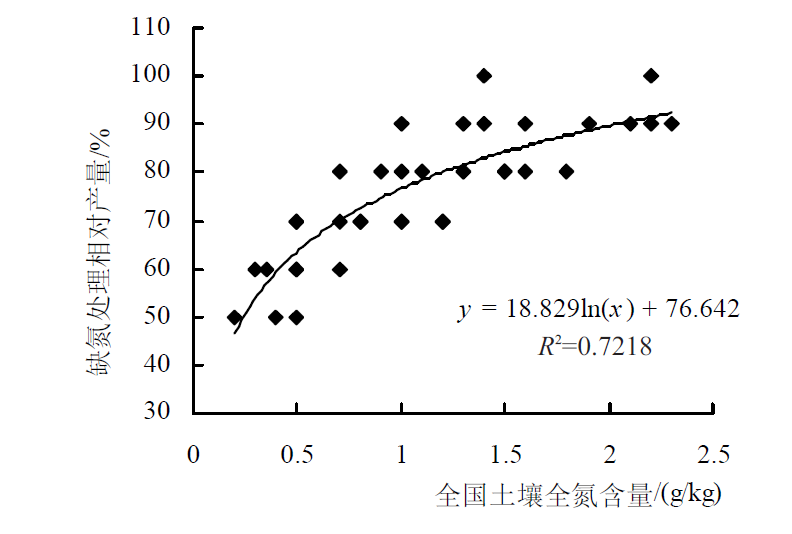
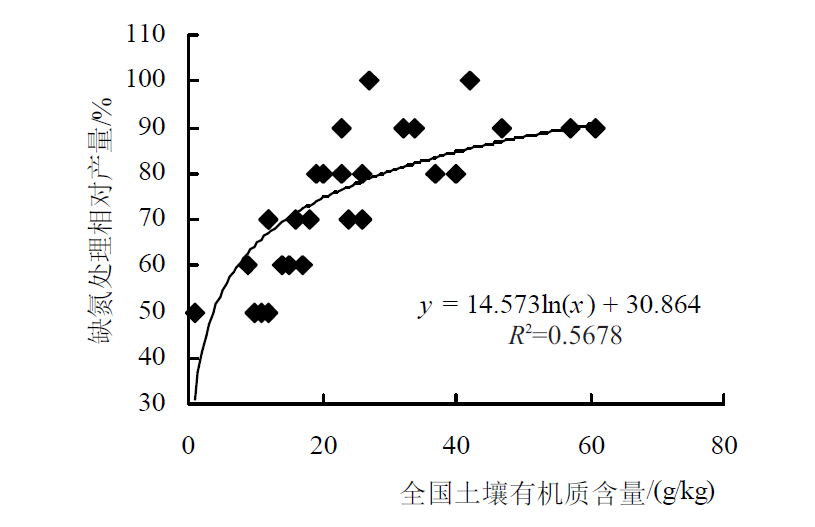
为了给玉米测土施氮提供科学依据,采用零散理论数据整合法、土壤养分含量与缺素处理相对产量回归方程法和“养分平衡—地力差减法”确定适宜施肥量新应用公式,开展了东北平原、黄淮海平原、黄土高原、西南山地丘陵区和全国玉米土壤氮素丰缺指标与适宜施氮量研究。结果表明:东北平原玉米土壤碱解氮第1~7级丰缺指标依次为≥417、263~417、166~263、105~166、67~105、42~67、<42 mg/kg,黄淮海平原依次为≥177、124~177、87~124、61~87、42~61、30~42、<30 mg/kg,黄土高原依次为≥191、131~191、90~131、62~90、43~62、30~43、<30 mg/kg,西南山地丘陵区依次为≥349、221~349、140~221、88~140、56~88、36~56、<36 mg/kg;全国玉米土壤全氮第1~7级丰缺指标依次为≥3.5、2.1~3.5、1.2~2.1、0.70~1.2、0.42~0.70、0.25~0.42、<0.25 g/kg;全国玉米土壤有机质第2~7级丰缺指标依次为≥58、30~58、15~30、7.4~15、3.8~7.4、<3.8 g/kg。当氮肥当季利用率40%时,土壤氮素丰缺级别第1~7级的籽实玉米(目标产量6~15 t/hm 2)适宜施氮量范围依次为0~0、35~86、69~173、104~259、138~345、173~431、207~518 kg/hm 2,青贮玉米(目标产量30~120 t/hm 2)依次为0~0、30~120、60~240、90~360、120~480、150~600和180~ 720 kg/hm 2。
中图分类号:
孙洪仁, 张吉萍, 冮丽华, 吕玉才, 王应海. 四大自然区域和全国玉米土壤氮素丰缺指标推荐施肥系统[J]. 中国农学通报, 2020, 36(14): 80-87.
Sun Hongren, Zhang Jiping, Gang Lihua, Lv Yucai, Wang Yinghai. Corn Fertilizer Recommendation System Based on Abundance-deficiency Index of Soil N in Four Great Natural Regions and Whole China[J]. Chinese Agricultural Science Bulletin, 2020, 36(14): 80-87.
| 养分 | 自然区域 | 行政区域 | 回归方程 | 样本数 (n) | 缺氮处理相对产量 | |||||
|---|---|---|---|---|---|---|---|---|---|---|
| 50% | 60% | 70% | 80% | 90% | 100% | |||||
| 碱解氮/ (mg/kg) | 东北平原 | 吉林东部[ | y=28.977 lnx -71.163 | 58 | 92 | 131 | 184 | 260 | 368 | |
| 吉林中部[ | y=21.901 lnx -21.926 | 69 | 67 | 105 | 166 | 262 | ||||
| 吉林西部[ | y=30.332 lnx -68.758 | 49 | 50 | 70 | 97 | 135 | ||||
| 吉林东辽[ | y=42.602 lnx -144.17 | 32 | 153 | 193 | 244 | 308 | ||||
| 辽宁省[ | y=100-52.3303×10 Exp(-0.0026x) | 32 | 45 | 93 | 161 | |||||
| 辽宁北部[ | y=39.7378 lnx -28.4674 | 24 | 72 | 93 | 119 | 153 | 197 | 254 | ||
| 黑龙江虎林[ | y=31.121 lnx -95.272 | 30 | 203 | 279 | 385 | |||||
| 黄淮海平原 | 河北涿州[ | y=50.36 lnx -144.78 | 10 | 71 | 87 | 106 | 129 | |||
| 山东莱阳[ | y=24.04 lnx -22.05 | 20 | 30 | 46 | 70 | 106 | ||||
| 山东郯城[ | y=x/(0.0063x+0.544) | 7 | 68 | 88 | 113 | |||||
| 山东临沂河东[ | y=43.96 lnx -118.27 | 20 | 72 | 91 | 114 | |||||
| 山东阳谷[ | y=110.607 lgx-122.98 | 7 | 68 | 84 | ||||||
| 山东烟台牟平[ | y=43.257 lnx -119.93 | 23 | 51 | 64 | 81 | 102 | 128 | 162 | ||
| 山东阳信[ | y=60.277 lnx -196.52 | 15 | 83 | 98 | 116 | |||||
| 山东泰安岱岳[ | y=20.36 lnx -9.8084 | 12 | 50 | 82 | 135 | |||||
| 黄土高原 | 山西原平[ | y=27.510 lnx -45.482 | 67 | 96 | 138 | |||||
| 陕西黄陵[ | y=33.523 lnx -41.735 | 15 | 38 | 51 | 69 | |||||
| 陕西铜川耀州[ | y=28.527 lnx -52.972 | 13 | 37 | 53 | 75 | 106 | ||||
| 陕西关中平原[ | y=24.809 lnx -23.774 | 62 | 66 | 98 | 147 | |||||
| 陕西宝鸡陈仓[ | y=22.158 lnx -11.722 | 26 | 26 | 40 | 63 | 99 | ||||
| 甘肃平凉[ | y=36.372 lnx -83.513 | 56 | 68 | 90 | 118 | |||||
| 甘肃庄浪[ | y=53.518 lnx -169.72 | 10 | 61 | 73 | 88 | 106 | 128 | 154 | ||
| 甘肃会宁[ | y=27.973 lnx -45.035 | 24 | 30 | 43 | 61 | 87 | 125 | |||
| 甘肃靖远[ | y=47.776 lnx -133.36 | 6 | 71 | 87 | 107 | |||||
| 西南山地丘陵区 | 陕西安康[ | y=27.03 lnx -53.829 | 13 | 47 | 67 | 98 | 141 | 205 | ||
| 陕西安康[ | y=72.465 lnx -284.47 | 17 | 101 | 116 | 133 | 153 | 176 | 202 | ||
| 四川中部丘陵[ | y=1.226x+48.429 | 146 | 46 | 116 | 186 | 256 | ||||
| 四川合江[ | y=31.943 lnx -65.873 | 17 | 38 | 52 | 70 | 96 | 132 | 180 | ||
| 重庆长寿[ | y=33.184 lnx -74.552 | 31 | 43 | 58 | 78 | 105 | 142 | 193 | ||
| 云南省[ | y=18.538 lnx -12.599 | 384 | 29 | 50 | 86 | 148 | 253 | 434 | ||
| 碱解氮/ (mg/kg) | 西南山地丘陵区 | 云南曲靖[ | y=27.26 lnx -55.31 | 74 | 48 | 69 | 99 | 143 | 207 | 298 |
| 云南永善[ | y=13.37 lnx +16.62 | 20 | 54 | 115 | 242 | 511 | ||||
| 全氮/ (g/kg) | 全国 | 内蒙古科尔沁右翼中旗[ | y=23.799 lnx +70.481 | 30 | 1 | 1.5 | 2.3 | |||
| 内蒙古扎鲁特旗[ | y=44.997 lnx +60.188 | 38 | 1.2 | 1.6 | 1.9 | |||||
| 内蒙古锡林浩特[ | y=19.3 lnx +74.52 | 40 | 0.8 | 1.3 | 2.2 | |||||
| 内蒙古乌拉特中旗[ | y=30.674 lnx +81.079 | 30 | 0.7 | 1 | 1.3 | |||||
| 内蒙古河套平原[ | y=21.317 lnx +83.393 | 155 | 0.2 | 0.3 | 0.5 | 0.9 | 1.4 | 2.2 | ||
| 内蒙古杭锦旗[ | y=29.289 lnx +90.909 | 25 | 0.35 | 0.5 | 0.7 | 1 | 1.4 | |||
| 甘肃白银平川[ | y=26.495 lnx +77.589 | 21 | 0.4 | 0.5 | 0.8 | 1.1 | 1.6 | |||
| 甘肃会宁[ | y=29.048 lnx +69.03 | 24 | 0.5 | 0.7 | 1 | 1.5 | 2.1 | |||
| 四川中部丘陵[ | y=15.066x+52.51 | 146 | 0.5 | 1.2 | 1.8 | |||||
| 安徽淮北[ | y=56.657 lnx +47.049 | 28 | 1 | 1.3 | 1.5 | 1.8 | ||||
| 有机质/ (g/kg) | 全国 | 内蒙古锡林浩特[ | y=19.83 lnx +21.41 | 40 | 12 | 19 | 32 | |||
| 山西原平[ | y =14.326 lnx +34.997 | 12 | 23 | 47 | ||||||
| 安徽淮北[ | y=59.052 lnx -95.284 | 46 | 12 | 14 | 16 | 20 | 23 | 27 | ||
| 湖南红壤[ | y=22.74 lnx -2.06 | 57 | 10 | 15 | 24 | 37 | 57 | |||
| 湖南水稻土[ | y=23.32 lnx -5.71 | 99 | 11 | 17 | 26 | 40 | 61 | |||
| 四川中部丘陵[ | y=1.226x+48.429 | 146 | 1 | 9 | 18 | 26 | 34 | 42 | ||
| 养分 | 自然区域 | 行政区域 | 回归方程 | 样本数 (n) | 缺氮处理相对产量 | |||||
|---|---|---|---|---|---|---|---|---|---|---|
| 50% | 60% | 70% | 80% | 90% | 100% | |||||
| 碱解氮/ (mg/kg) | 东北平原 | 吉林东部[ | y=28.977 lnx -71.163 | 58 | 92 | 131 | 184 | 260 | 368 | |
| 吉林中部[ | y=21.901 lnx -21.926 | 69 | 67 | 105 | 166 | 262 | ||||
| 吉林西部[ | y=30.332 lnx -68.758 | 49 | 50 | 70 | 97 | 135 | ||||
| 吉林东辽[ | y=42.602 lnx -144.17 | 32 | 153 | 193 | 244 | 308 | ||||
| 辽宁省[ | y=100-52.3303×10 Exp(-0.0026x) | 32 | 45 | 93 | 161 | |||||
| 辽宁北部[ | y=39.7378 lnx -28.4674 | 24 | 72 | 93 | 119 | 153 | 197 | 254 | ||
| 黑龙江虎林[ | y=31.121 lnx -95.272 | 30 | 203 | 279 | 385 | |||||
| 黄淮海平原 | 河北涿州[ | y=50.36 lnx -144.78 | 10 | 71 | 87 | 106 | 129 | |||
| 山东莱阳[ | y=24.04 lnx -22.05 | 20 | 30 | 46 | 70 | 106 | ||||
| 山东郯城[ | y=x/(0.0063x+0.544) | 7 | 68 | 88 | 113 | |||||
| 山东临沂河东[ | y=43.96 lnx -118.27 | 20 | 72 | 91 | 114 | |||||
| 山东阳谷[ | y=110.607 lgx-122.98 | 7 | 68 | 84 | ||||||
| 山东烟台牟平[ | y=43.257 lnx -119.93 | 23 | 51 | 64 | 81 | 102 | 128 | 162 | ||
| 山东阳信[ | y=60.277 lnx -196.52 | 15 | 83 | 98 | 116 | |||||
| 山东泰安岱岳[ | y=20.36 lnx -9.8084 | 12 | 50 | 82 | 135 | |||||
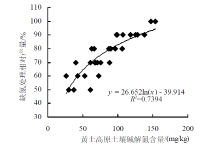
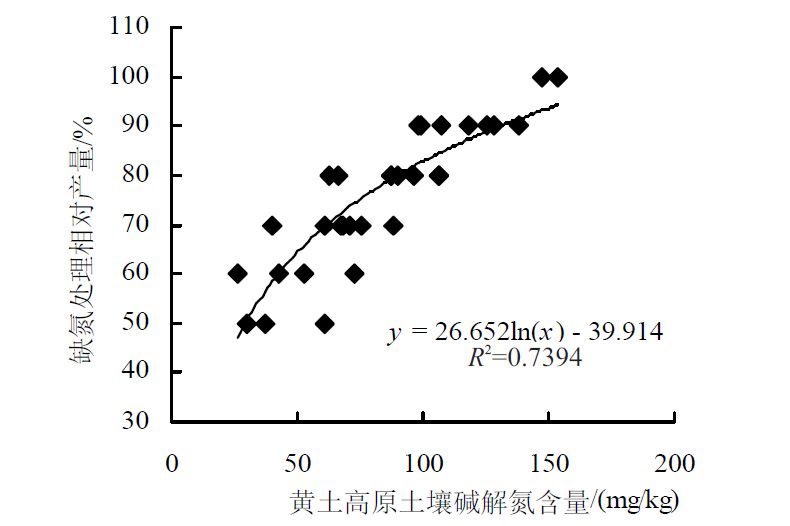
| 黄土高原 | 山西原平[ | y=27.510 lnx -45.482 | 67 | 96 | 138 | |||||
| 陕西黄陵[ | y=33.523 lnx -41.735 | 15 | 38 | 51 | 69 | |||||
| 陕西铜川耀州[ | y=28.527 lnx -52.972 | 13 | 37 | 53 | 75 | 106 | ||||
| 陕西关中平原[ | y=24.809 lnx -23.774 | 62 | 66 | 98 | 147 | |||||
| 陕西宝鸡陈仓[ | y=22.158 lnx -11.722 | 26 | 26 | 40 | 63 | 99 | ||||
| 甘肃平凉[ | y=36.372 lnx -83.513 | 56 | 68 | 90 | 118 | |||||
| 甘肃庄浪[ | y=53.518 lnx -169.72 | 10 | 61 | 73 | 88 | 106 | 128 | 154 | ||
| 甘肃会宁[ | y=27.973 lnx -45.035 | 24 | 30 | 43 | 61 | 87 | 125 | |||
| 甘肃靖远[ | y=47.776 lnx -133.36 | 6 | 71 | 87 | 107 | |||||
| 西南山地丘陵区 | 陕西安康[ | y=27.03 lnx -53.829 | 13 | 47 | 67 | 98 | 141 | 205 | ||
| 陕西安康[ | y=72.465 lnx -284.47 | 17 | 101 | 116 | 133 | 153 | 176 | 202 | ||
| 四川中部丘陵[ | y=1.226x+48.429 | 146 | 46 | 116 | 186 | 256 | ||||
| 四川合江[ | y=31.943 lnx -65.873 | 17 | 38 | 52 | 70 | 96 | 132 | 180 | ||
| 重庆长寿[ | y=33.184 lnx -74.552 | 31 | 43 | 58 | 78 | 105 | 142 | 193 | ||
| 云南省[ | y=18.538 lnx -12.599 | 384 | 29 | 50 | 86 | 148 | 253 | 434 | ||
| 碱解氮/ (mg/kg) | 西南山地丘陵区 | 云南曲靖[ | y=27.26 lnx -55.31 | 74 | 48 | 69 | 99 | 143 | 207 | 298 |
| 云南永善[ | y=13.37 lnx +16.62 | 20 | 54 | 115 | 242 | 511 | ||||
| 全氮/ (g/kg) | 全国 | 内蒙古科尔沁右翼中旗[ | y=23.799 lnx +70.481 | 30 | 1 | 1.5 | 2.3 | |||
| 内蒙古扎鲁特旗[ | y=44.997 lnx +60.188 | 38 | 1.2 | 1.6 | 1.9 | |||||
| 内蒙古锡林浩特[ | y=19.3 lnx +74.52 | 40 | 0.8 | 1.3 | 2.2 | |||||
| 内蒙古乌拉特中旗[ | y=30.674 lnx +81.079 | 30 | 0.7 | 1 | 1.3 | |||||
| 内蒙古河套平原[ | y=21.317 lnx +83.393 | 155 | 0.2 | 0.3 | 0.5 | 0.9 | 1.4 | 2.2 | ||
| 内蒙古杭锦旗[ | y=29.289 lnx +90.909 | 25 | 0.35 | 0.5 | 0.7 | 1 | 1.4 | |||
| 甘肃白银平川[ | y=26.495 lnx +77.589 | 21 | 0.4 | 0.5 | 0.8 | 1.1 | 1.6 | |||
| 甘肃会宁[ | y=29.048 lnx +69.03 | 24 | 0.5 | 0.7 | 1 | 1.5 | 2.1 | |||
| 四川中部丘陵[ | y=15.066x+52.51 | 146 | 0.5 | 1.2 | 1.8 | |||||
| 安徽淮北[ | y=56.657 lnx +47.049 | 28 | 1 | 1.3 | 1.5 | 1.8 | ||||
| 有机质/ (g/kg) | 全国 | 内蒙古锡林浩特[ | y=19.83 lnx +21.41 | 40 | 12 | 19 | 32 | |||
| 山西原平[ | y =14.326 lnx +34.997 | 12 | 23 | 47 | ||||||
| 安徽淮北[ | y=59.052 lnx -95.284 | 46 | 12 | 14 | 16 | 20 | 23 | 27 | ||
| 湖南红壤[ | y=22.74 lnx -2.06 | 57 | 10 | 15 | 24 | 37 | 57 | |||
| 湖南水稻土[ | y=23.32 lnx -5.71 | 99 | 11 | 17 | 26 | 40 | 61 | |||
| 四川中部丘陵[ | y=1.226x+48.429 | 146 | 1 | 9 | 18 | 26 | 34 | 42 | ||


| 级别 | 7 | 6 | 5 | 4 | 3 | 2 | 1 | |
|---|---|---|---|---|---|---|---|---|
| 相对产量 | <50 | 50~60 | 60~70 | 70~80 | 80~90 | 90~100 | ≥100 | |
| 碱解氮/ (mg/kg) | 东北平原 | <42 | 42~67 | 67~105 | 105~166 | 166~263 | 263~417 | ≥417 |
| 黄淮海平原 | <30 | 30~42 | 42~61 | 61~87 | 87~124 | 124~177 | ≥177 | |
| 黄土高原 | <30 | 30~43 | 43~62 | 62~90 | 90~131 | 131~191 | ≥191 | |
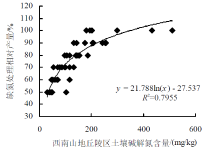
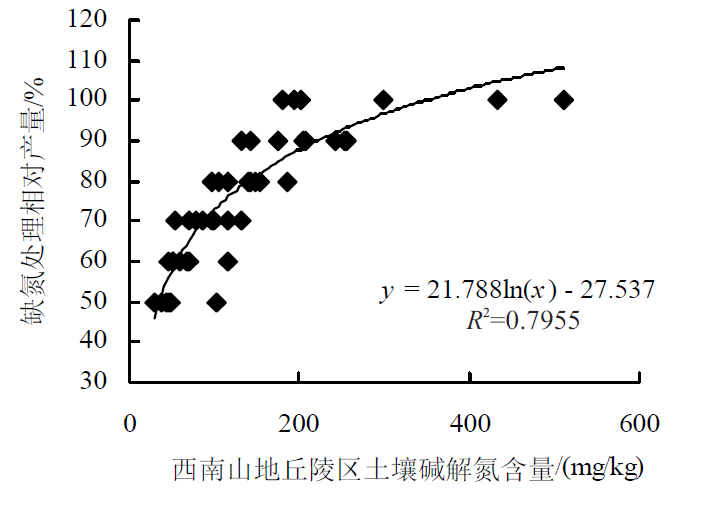
| 西南山地丘陵区 | <36 | 36~56 | 56~88 | 88~140 | 140~221 | 221~349 | ≥349 | |
| 全氮/(g/kg) | 全国 | <0.25 | 0.25~0.42 | 0.42~0.70 | 0.70~1.2 | 1.2~2.1 | 2.1~3.5 | ≥3.5 |
| 有机质/(g/kg) | 全国 | <3.8 | 3.8~7.4 | 7.4~15 | 15~30 | 30~58 | ≥58 | |
| 级别 | 7 | 6 | 5 | 4 | 3 | 2 | 1 | |
|---|---|---|---|---|---|---|---|---|
| 相对产量 | <50 | 50~60 | 60~70 | 70~80 | 80~90 | 90~100 | ≥100 | |
| 碱解氮/ (mg/kg) | 东北平原 | <42 | 42~67 | 67~105 | 105~166 | 166~263 | 263~417 | ≥417 |
| 黄淮海平原 | <30 | 30~42 | 42~61 | 61~87 | 87~124 | 124~177 | ≥177 | |
| 黄土高原 | <30 | 30~43 | 43~62 | 62~90 | 90~131 | 131~191 | ≥191 | |
| 西南山地丘陵区 | <36 | 36~56 | 56~88 | 88~140 | 140~221 | 221~349 | ≥349 | |
| 全氮/(g/kg) | 全国 | <0.25 | 0.25~0.42 | 0.42~0.70 | 0.70~1.2 | 1.2~2.1 | 2.1~3.5 | ≥3.5 |
| 有机质/(g/kg) | 全国 | <3.8 | 3.8~7.4 | 7.4~15 | 15~30 | 30~58 | ≥58 | |
| 目标产量/(t/hm2) | 级别 | 7 | 6 | 5 | 4 | 3 | 2 | 1 |
|---|---|---|---|---|---|---|---|---|
| 相对产量/% | <50 | 50~60 | 60~70 | 70~80 | 80~90 | 90~100 | >100 | |
| 6.0 | A | ≥166 | 138 | 110 | 83 | 55 | 28 | 0 |
| B | ≥207 | 173 | 138 | 104 | 69 | 35 | 0 | |
| C | ≥276 | 230 | 184 | 138 | 92 | 46 | 0 | |
| 7.5 | A | ≥207 | 173 | 138 | 104 | 69 | 35 | 0 |
| B | ≥259 | 216 | 173 | 129 | 86 | 43 | 0 | |
| C | ≥345 | 288 | 230 | 173 | 116 | 57 | 0 | |
| 9.0 | A | ≥248 | 207 | 166 | 124 | 83 | 41 | 0 |
| B | ≥311 | 259 | 207 | 155 | 104 | 52 | 0 | |
| C | ≥414 | 346 | 275 | 207 | 139 | 68 | 0 | |
| 10.5 | A | ≥290 | 242 | 193 | 145 | 97 | 48 | 0 |
| B | ≥362 | 302 | 242 | 181 | 121 | 60 | 0 | |
| C | ≥483 | 403 | 321 | 242 | 162 | 80 | 0 | |
| 12.0 | A | ≥331 | 276 | 221 | 166 | 110 | 55 | 0 |
| B | ≥414 | 345 | 276 | 207 | 138 | 69 | 0 | |
| C | ≥552 | 461 | 367 | 276 | 185 | 91 | 0 | |
| 13.5 | A | ≥373 | 311 | 248 | 186 | 124 | 62 | 0 |
| B | ≥466 | 388 | 311 | 233 | 155 | 78 | 0 | |
| C | ≥621 | 519 | 413 | 311 | 208 | 103 | 0 | |
| 15.0 | A | ≥414 | 345 | 276 | 207 | 138 | 69 | 0 |
| B | ≥518 | 431 | 345 | 259 | 173 | 86 | 0 | |
| C | ≥690 | 576 | 459 | 345 | 231 | 114 | 0 |
| 目标产量(t/hm2) | 级别 | 7 | 6 | 5 | 4 | 3 | 2 | 1 |
|---|---|---|---|---|---|---|---|---|
| 相对产量/% | <50 | 50~60 | 60~70 | 70~80 | 80~90 | 90~100 | >100 | |
| 30 | A | ≥144 | 120 | 96 | 72 | 48 | 24 | 0 |
| B | ≥180 | 150 | 120 | 90 | 60 | 30 | 0 | |
| C | ≥240 | 200 | 160 | 120 | 80 | 40 | 0 | |
| 45 | A | ≥216 | 180 | 144 | 108 | 72 | 36 | 0 |
| B | ≥270 | 225 | 180 | 135 | 90 | 45 | 0 | |
| C | ≥360 | 301 | 239 | 180 | 121 | 60 | 0 | |
| 60 | A | ≥288 | 240 | 192 | 144 | 96 | 48 | 0 |
| B | ≥360 | 300 | 240 | 180 | 120 | 60 | 0 | |
| C | ≥480 | 401 | 319 | 240 | 161 | 79 | 0 | |
| 75 | A | ≥360 | 300 | 240 | 180 | 120 | 60 | 0 |
| B | ≥450 | 375 | 300 | 225 | 150 | 75 | 0 | |
| C | ≥600 | 501 | 399 | 300 | 201 | 99 | 0 | |
| 90 | A | ≥432 | 360 | 288 | 216 | 144 | 72 | 0 |
| B | ≥540 | 450 | 360 | 270 | 180 | 90 | 0 | |
| C | ≥720 | 601 | 479 | 360 | 241 | 119 | 0 | |
| 105 | A | ≥504 | 420 | 336 | 252 | 168 | 84 | 0 |
| B | ≥630 | 525 | 420 | 315 | 210 | 105 | 0 | |
| C | ≥840 | 701 | 559 | 420 | 281 | 139 | 0 | |
| 120 | A | ≥576 | 480 | 384 | 288 | 192 | 96 | 0 |
| B | ≥720 | 600 | 480 | 360 | 240 | 120 | 0 | |
| C | ≥960 | 802 | 638 | 480 | 322 | 158 | 0 |
| [1] | 周鸣铮 . 中国的测土施肥[J]. 土壤通报, 1987,18(1):7-13. |
| [2] | 黄德明 . 我国农田土壤养分肥力状况及丰缺指标[J]. 华北农学报, 1988,3(2):46-53. |
| [3] | 孙洪仁, 曾红, 赵雅晴 , 等. 中国玉米土壤氮素丰缺指标与适宜施氮量[J]. 北方农业学报, 2017,45(3):40-49. |
| [4] | 孙洪仁, 赵雅晴, 曾红 , 等. 中国若干区域玉米土壤有效磷丰缺指标与适宜施磷量[J]. 中国土壤与肥料, 2017(2):26-34. |
| [5] | 孙洪仁, 刘江扬, 赵雅晴 , 等. 中国玉米土壤速效钾丰缺指标与适宜施钾量研究[J]. 中国土壤与肥料, 2017(5):29-37. |
| [6] | 孙洪仁, 曹影, 刘琳 , 等. 测土施肥土壤有效养分丰缺分级改良方案[J]. 黑龙江畜牧兽医, 2014(19):1-5. |
| [7] | 孙洪仁, 曹影, 刘琳 , 等. “养分平衡—地力差减法”确定适宜施肥量的新应用公式[J]. 黑龙江畜牧兽医, 2014(7):1-4. |
| [8] | 孙洪仁, 曹影, 刘琳 , 等. 测土施肥不同丰缺级别土壤的的适宜施肥量[J]. 黑龙江畜牧兽医, 2014(23):7-11. |
| [9] | 高祥照, 马常宝, 杜森 . 测土配方施肥技术[M]. 北京: 中国农业出版社, 2005: 132. |
| [10] | 孙洪仁, 赵雅晴, 曾红 , 等. 青贮玉米施肥的理论和技术[J]. 中国奶牛, 2018(24):55-59. |
| [11] | 汪娟娟 . 吉林省玉米施肥技术指标体系的建立[D]. 长春:吉林农业大学, 2008. |
| [12] | 陈雪艳 . 吉林省东辽县玉米土壤养分丰缺指标和施肥指标[J]. 辽宁农业科学, 2011(6):21-24. |
| [13] | 李金风, 姜娟, 赵斌 , 等. 关于平衡施肥中土壤供肥性能的研究[J]. 土壤通报, 2002,33(5):351-355. |
| [14] | 张士昌, 张树泽, 邓贵仁, 原奎栋 . 玉米经济施肥的研究[J]. 土壤通报, 1986(1):22-26. |
| [15] | 屈玉媛, 史翠萍, 王明东 , 等. 玉米施肥指标体系的初步建立[J]. 现代化农业, 2012(10):14-16. |
| [16] | 高菲 . 涿州粮田土壤养分库容评价及小麦合理施肥技术研究[D]. 保定:河北农业大学, 2008. |
| [17] | 赵镭, 隋方功 . 夏玉米地土壤养分丰缺指标的研究[J]. 莱阳农学院学报, 1986(1):28-35. |
| [18] | 李建军, 刘慧芹, 刘维芳 , 等. 黄淮海地区夏玉米施肥技术参数与指标体系的研究[J]. 河北农业科学, 2008,12(6):43-45. |
| [19] | 杨美良, 傅德峰, 杜广明 , 等. 玉米高产测土施肥指标的研究[J]. 现代农业科技, 2008(16):192-197. |
| [20] | 王伟 . 夏玉米土壤养分丰缺指标及氮磷肥料效应研究[J]. 现代农业科技, 2010(13):52-53. |
| [21] | 阎雪容, 张智波, 刘华君 , 等. 夏玉米土壤氮磷养分丰缺指标研究[J]. 山西农业科学, 2017,45(12):1965-1968. |
| [22] | 邓婷婷 . 阳信县夏玉米土壤养分丰缺指标和施肥指标体系研究[J]. 种业导刊, 2017(4):19-22. |
| [23] | 王鹏 . 岱岳区冬小麦、夏玉米土壤养分现状及施肥指标构建[D]. 泰安:山东农业大学, 2017. |
| [24] | 冯向阳, 孟祥婵 . 县域测土配方施肥指标体系参数分析建立与应用[J]. 河北农业科学, 2012,16(3):56-59. |
| [25] | 王斌, 杨延军, 张伟 , 等. 黄陵县土壤养分丰缺指标和施肥指标体系的制定[J]. 吉林农业科学, 2012,37(5):28-33. |
| [26] | 雷彦宁, 阴少锋 . 铜川市耀州区土壤养分丰缺指标研究初报[J]. 农业与技术, 2013,33(12):15-16. |
| [27] | 付莹莹, 同延安, 赵佐平 , 等. 陕西关中灌区夏玉米土壤养分丰缺及推荐施肥指标体系的建立[J]. 干旱地区农业研究, 2010,28(1):88-93. |
| [28] | 马志超, 张明学, 周仓军 , 等. 关中西部玉米氮磷钾养分丰缺指标及经济最佳施肥量研究[J]. 西北农林科技大学学报:自然科学版, 2015,43(11):1-7 |
| [29] | 陈永军 . 平凉市黑垆土玉米施肥指标体系研究[J]. 甘肃农业科技, 2016(10):39-41. |
| [30] | 张立功, 高应平, 魏礼明 , 等. 庄浪县全膜双垄沟播玉米测土配方施肥指标研究[J]. 甘肃农业科技, 2010(10):34-36. |
| [31] | 任亮, 任稳江 . 西北半干旱地区玉米土壤养分丰缺指标研究[J]. 中国土壤与肥料, 2014(5):5-10. |
| [32] | 陈定顺 . 靖远县玉米测土配方施肥指标研究[J]. 甘肃农业, 2010(1): 90, 93. |
| [33] | 靳子斌, 胡松, 陈友乾 . 安康市低山区玉米耕地土壤养分现状及施肥建议[J]. 现代农业科技, 2017(2):32-33. |
| [34] | 张莉, 刘文, 陈友乾 . 安康市中山区玉米耕地土壤养分现状调查及施肥建议[J]. 现代农业科技, 2017(9):218-219. |
| [35] | 蒋虹荣, 李廷轩, 戢林 , 等. 川中丘陵区玉米土壤供氮能力与推荐施氮指标的构建[J]. 西南农业学报, 2015,28(2):637-643. |
| [36] | 孙先明, 李为民, 林良福 . 合江县玉米施肥指标体系与配方分区研究[A].见:中国土壤学会.中国土壤学会第十二次全国会员代表大会暨第九届海峡两岸土壤肥料学术交流研讨会论文集[C]. 成都:中国土壤学会, 2012: 668-672. |
| [37] | 唐晓东, 陈燕霞, 张树全 , 等. 三峡库区小流域紫色土玉米推荐施肥指标体系研究[J]. 山地农业生物学报, 2016,35(4):42-47. |
| [38] | 熊艳, 王平华, 何晓滨 , 等. 云南省旱地玉米土壤养分丰缺指标及肥料利用率研究[J]. 西南农业学报, 2013,26(1):203-208. |
| [39] | 尹梅, 洪丽芳, 付利波 , 等. 滇东红壤区不同海拔高度带玉米的土壤养分丰缺指标研究[J]. 中国土壤与肥料, 2012(3):35-39. |
| [40] | 张锴, 马各富 . 永善县玉米土壤养分丰缺及推荐施肥指标体系的建立[J]. 现代农业科技, 2014(1):14-15,17. |
| [41] | 张玉珠, 张建玲, 冯建军 , 等. 科尔沁右翼中旗玉米施肥现状与测土配方施肥技术[J]. 内蒙古民族大学学报:自然科学版, 2016,31(3):220-224,231. |
| [42] | 潘峰, 陶杰, 冯建军 , 等. 内蒙古扎鲁特旗春玉米推荐施肥指标体系研究[J]. 内蒙古民族大学学报:自然科学版, 2011,26(4):424-428. |
| [43] | 韩宝萍, 公未未, 柳金财, 阿拉坦存布尔 . 内蒙古锡林浩特市水浇地青贮玉米施肥指标体系的建立[J]. 畜牧与饲料科学, 2018,39(7):65-69. |
| [44] | 刘慧忠, 武敏, 潘锋 . 乌拉特中旗灌区春玉米土壤养分丰缺指标初步研究[J]. 新农村, 2011(2):33. |
| [45] | 李文彪, 刘荣乐, 郑海春 , 等. 内蒙古河套灌区春玉米推荐施肥指标体系研究[J]. 中国农业科学, 2012,45(1):93-101. |
| [46] | 赵丽, 刘惠青, 张贺英 . 杭锦旗玉米推荐施肥指标体系的建立[J]. 天津农业科学, 2017,23(3):21-25,31. |
| [47] | 李云祥, 王兴富, 冯玉磊 , 等. 甘肃中部地区水砂田玉米土壤养分丰缺指标研究[J]. 土壤通报, 2017,48(1):182-189. |
| [48] | 王勇 . 区域土壤养分状况综合评价及主要作物施肥指标体系研究[D]. 合肥:安徽农业大学, 2011. |
| [49] | 郭欢乐, 陈志辉, 曹钟洋 , 等. 湖南省春玉米土壤养分丰缺指标构建研究[J]. 作物研究, 2017,31(3):239-245. |
| [50] | 张福锁, 陈新平, 陈清 . 中国主要作物施肥指南[M]. 北京: 中国农业大学出版社, 2009: 6-27. |
| [1] | 王绍新, 王宝宝, 李中建, 许洛, 冯健英. 中国鲜食玉米的研究脉络和趋势探析[J]. 中国农学通报, 2023, 39(1): 8-15. |
| [2] | 纪坤, 王彬, 赵博文, 薛浩, 吴建民, 朱晓建, 王依欣, 赵海军, 韩赞平. 不同玉米种质材料植株与穗粒性状的灰色关联度分析[J]. 中国农学通报, 2022, 38(9): 27-32. |
| [3] | 付焱焱, 李云峰, 韩冬, 马树庆. 吉林省粮食主产区玉米生长季水分盈亏及其对产量的影响[J]. 中国农学通报, 2022, 38(7): 99-105. |
| [4] | 李祥, 王永平, 王耀凤, 褚春年, 孙喜军, 柯希恒, 曾桥. 枝条有机肥最佳堆肥参数及施用效果研究[J]. 中国农学通报, 2022, 38(6): 63-68. |
| [5] | 张洪芬, 杨丽杰, 赵玉娟, 张峰. 陇东2020年“强凉夏”气候特征及对农业影响分析[J]. 中国农学通报, 2022, 38(5): 117-123. |
| [6] | 王彦, 朱凯迪, 孙洪仁, 张吉萍, 吕玉才, 王剑. 中国苹果土壤养分丰缺指标与适宜施肥量初步研究[J]. 中国农学通报, 2022, 38(5): 69-78. |
| [7] | 李锐, 尚霄, 尚春树, 常利芳, 闫蕾, 白建荣. SSR荧光检测解析224份山西玉米自交系的遗传结构与遗传关系[J]. 中国农学通报, 2022, 38(5): 9-16. |
| [8] | 周忠文, 张谋草, 刘英, 柳东慧, 张红妮, 张俊林, 韩博. 气象要素对陇东塬区春玉米灌浆速度影响分析[J]. 中国农学通报, 2022, 38(5): 94-98. |
| [9] | 王辉, 陆鑫海, 杜美芳, 张琪. 1960—2019年海河平原地区夏玉米生长季高温特征分析[J]. 中国农学通报, 2022, 38(4): 62-68. |
| [10] | 陈志, 陈度煌, 秦志清, 许姗, 周明龙. 雌性中国鲎不同组织营养成分比较分析[J]. 中国农学通报, 2022, 38(4): 153-156. |
| [11] | 孙彦铭, 黄少辉, 刘克桐, 杨云马, 杨军芳, 邢素丽, 贾良良. 土壤肥力差异对冀中南山前平原与低平原夏玉米产量的影响[J]. 中国农学通报, 2022, 38(35): 35-42. |
| [12] | 孙喜军, 邓睿, 吕爽, 高莹, 蔡苗, 缑巧红, 赵娟. 西安市农用地土壤有机质空间变异特征[J]. 中国农学通报, 2022, 38(35): 43-53. |
| [13] | 胡雪纯, 解文艳, 马晓楠, 周怀平, 杨振兴, 刘志平. 长期秸秆还田对旱地玉米土壤有机碳及碳库管理指数的影响[J]. 中国农学通报, 2022, 38(34): 8-13. |
| [14] | 刘东, 刘锐金. 基于SWOT-PEST分析的中国热带作物产业发展策略研究[J]. 中国农学通报, 2022, 38(32): 139-147. |
| [15] | 蒋菊芳, 杨华, 胡文青, 魏育国. 持续高温干旱胁迫对春玉米生长的影响[J]. 中国农学通报, 2022, 38(32): 63-68. |
| 阅读次数 | ||||||
|
全文 |
|
|||||
|
摘要 |
|
|||||