欢迎访问《中国农学通报》,

中国农学通报 ›› 2026, Vol. 42 ›› Issue (16): 20-24.doi: 10.11924/j.issn.1000-6850.casb2026-0073

• 农学·农业基础科学 • 上一篇    下一篇

马铃薯原种扩繁发棵期生长模型拟合与分析

林金秀(), 张鹏, 凌永胜, 李扬, 陈朝文, 郑雅超   

  1. 泉州市农业科学研究所/福建省农业科学院泉州分院, 福建泉州 362000
  • 收稿日期:2026-01-23 修回日期:2026-07-12 出版日期:2026-08-25 发布日期:2026-08-20
  • 作者简介:

    林金秀,男,1982年出生,福建莆田人,副研究员,硕士研究生,主要研究方向:马铃薯育种与栽培技术研究应用。E-mail:

  • 基金资助:
    福建省星火计划项目“加工专用型马铃薯新品种‘泉农薯6号’的推广应用”(2024S0028); 福建省科技计划项目“加工型马铃薯良种选育与大棚秋作套种丝瓜技术研究”(2023N0051)

Fitting and Analysis of Growth Model for Potato Pre-elite Seed During Tuber Initiation Stage

LIN Jinxiu(), ZHANG Peng, LING Yongsheng, LI Yang, CHEN Chaowen, ZHENG Yachao   

  1. Quanzhou Institute of Agricultural Sciences/Quanzhou Branch of Fujian Academy of Agricultural Sciences, Quanzhou, Fujian 362000
  • Received:2026-01-23 Revised:2026-07-12 Published:2026-08-25 Online:2026-08-20

摘要:

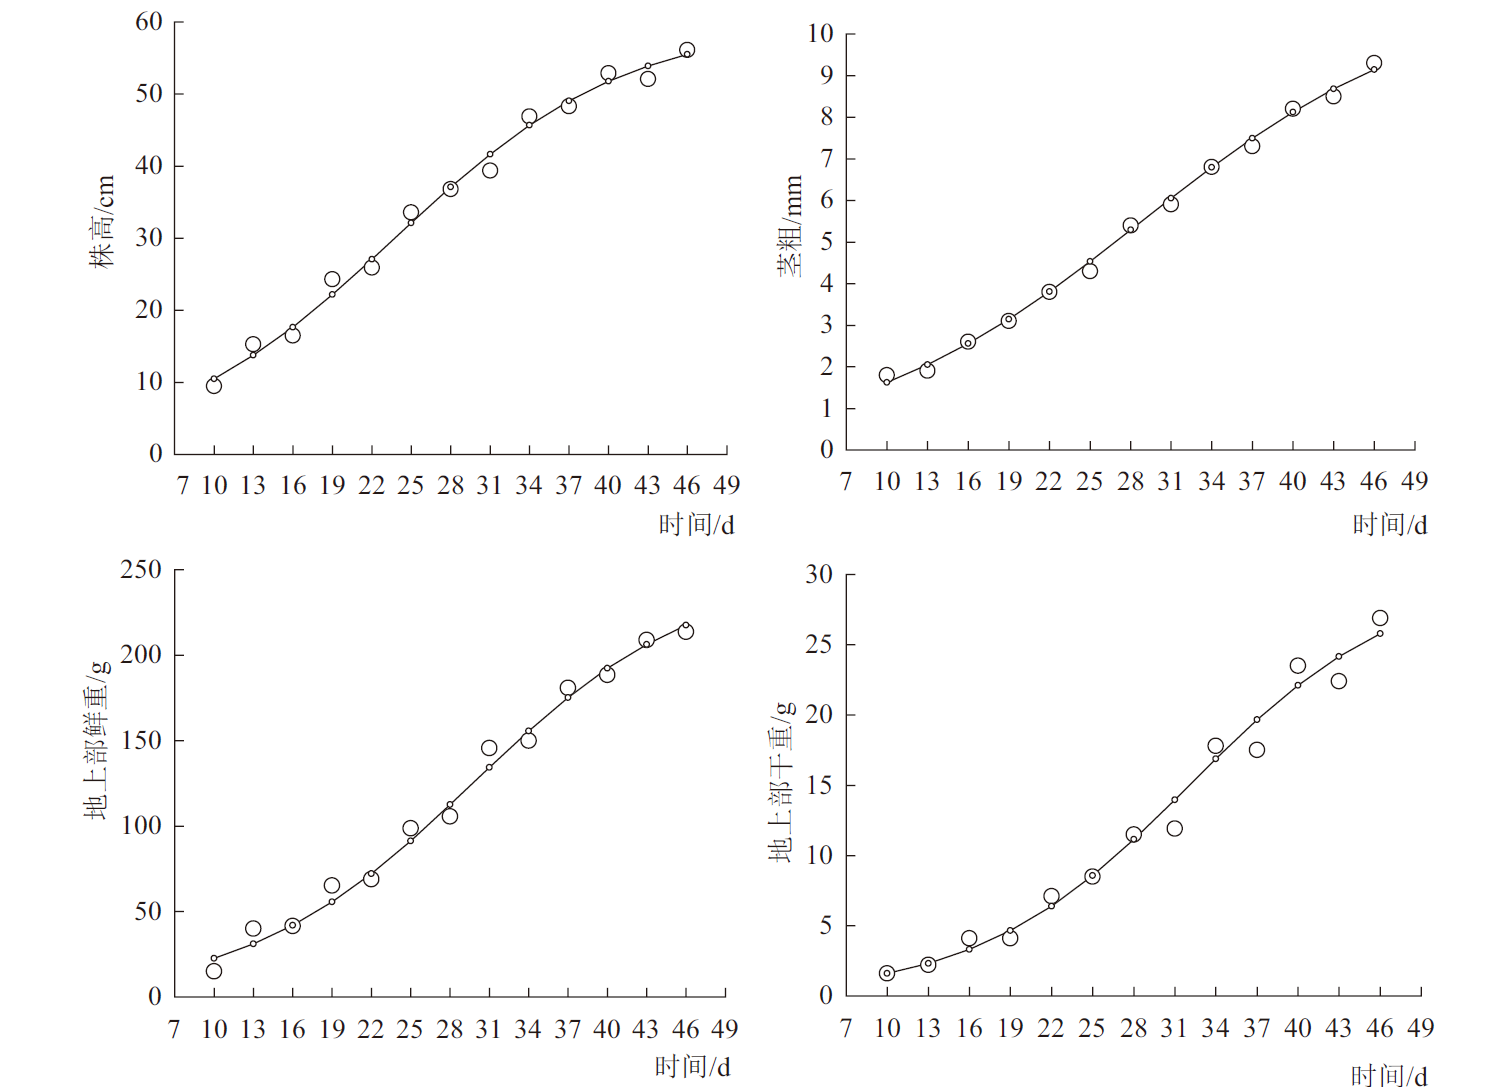
探究马铃薯原种繁育过程中发棵期关键性状指标的生长规律,为马铃薯原种繁育栽培管理提供参考依据。以‘泉薯5号’原原种为材料,通过连续观察发棵期的植株生长状况,采用logistic回归方程分别对发棵期的株高、茎粗、地上部鲜重、干重等生长指标进行拟合,建立生长模型。结果表明,马铃薯发棵期各生长指标的生长模型的判定系数R2均达到0.95以上,表明模型能够较好地拟合植株的生长动态。根据生长曲线的2个拐点,发棵期可划分为生长前期、速生期和生长末期3个阶段。其中,株高、茎粗、地上部鲜重、干重分别在播种后12、14.6、18.3、22.2 d进入速生期,线性生长速率分别为1.5 cm/d、0.2 mm/d、6.4 g/d、0.9 g/d,线性生长量分别为34.6 cm、6.4 mm、144.3 g、17.3 g;速生期最长的是茎粗,为28.3 d;最短的是地上部干重,为20.3 d;最大生长速率出现时间最早的是株高,最晚的是地上部干重,分别为播种后23.7、32.1 d。研究认为,logistic回归模型可以准确拟合马铃薯发棵期的植株生长动态,各生长指标的变化规律基本一致,均呈现典型的S型生长曲线特征。为此,建议根据各指标的生长规律,在速生期进行针对性的栽培管理,以最大限度地促进生长量积累,为结薯期的块茎膨大提供充足的养分基础。

关键词: 马铃薯, 原原种, ‘泉薯5号’, 发棵期, 生长模型, logistic回归, 物候期, 速生期

Abstract:

This study investigated the growth patterns of selected traits during the tuber initiation stage in potato pre-elite seed multiplication, aiming to provide a reference for cultivation and management of potato pre-elite seed. Pre-elite seeds of the potato variety ‘Quanshu No.5’ were used as materials, and plant growth during the tuber initiation stage was continuously observed. The logistic regression equation was applied to fit growth indicators including plant height, stem diameter, aboveground fresh weight, and aboveground dry weight, and growth models were subsequently established. The results showed that the coefficients of determination (R2) for all growth models during the tuber initiation stage exceeded 0.95, indicating a good fit for the plant growth dynamics. Based on the two inflection points in each growth curve, the tuber initiation stage for each indicator was divided into three phases: early growth phase, rapid growth phase, and late growth phase. Plant height, stem diameter, aboveground fresh weight, and aboveground dry weight entered the rapid growth phase at 12, 14.6, 18.3 and 22.2 days after planting, respectively. The linear growth rates during this phase were 1.5 cm/d, 0.2 mm/d, 6.4 g/d, and 0.9 g/d, with corresponding linear growth increments of 34.6 cm, 6.4 mm, 144.3 g, and 17.3 g, respectively. Among the indicators, stem diameter had the longest rapid growth phase (28.3 d), while aboveground dry weight had the shortest one (20.3 d). Plant height showed the earliest occurrence of the maximum growth rate (23.7 d after planting), whereas aboveground dry weight showed the latest (32.1 d after planting). The study concludes that the logistic regression model can accurately simulate plant growth dynamics during the potato tuber initiation stage. The growth patterns of the measured indicators are generally consistent and follow an S-shaped growth curve. It is therefore recommended that targeted management practices be implemented during the rapid growth phase based on the growth patterns of each indicator, so as to maximize growth increments and provide a sufficient nutrient foundation for tuber expansion during the tuber bulking stage.

Key words: potato, pre-elite seed, ‘Quanshu No.5’, tuber initiation stage, growth model, logistic regression, phenological period, fast-growing period

中图分类号: