欢迎访问《中国农学通报》,

中国农学通报 ›› 2025, Vol. 41 ›› Issue (3): 18-24.doi: 10.11924/j.issn.1000-6850.casb2024-0160

• 农学·农业基础科学 • 上一篇    下一篇

花生蔗糖含量与气象因素和品质性状的相关性分析

何柳1,2(), 原小燕1, 张玉松1, 刘丽晶3, 钟丽琼4, 赵凯琴1, 张立帆1, 何晓莹1, 符明联1()   

  1. 1 云南省农业科学院经济作物研究所,昆明 650205
    2 云南大学农学院,昆明 650500
    3 云南傣御农业科技有限公司,昆明 650051
    4 寻甸回族彝族自治县羊街镇农业农村发展服务中心,昆明 655209
  • 收稿日期:2024-03-12 修回日期:2024-06-15 出版日期:2025-01-20 发布日期:2025-01-20
  • 通讯作者:
    符明联,男,1972年出生,云南鲁甸人,研究员,博士,研究方向:油料作物产业化研究应用。通信地址:650221 云南省昆明市盘龙区北京路2238号云南省农业科学院经济作物研究所,Tel:0871-65893842,E-mail:
  • 作者简介:

    何柳,女,2000年出生,贵州盘州人,在读硕士,研究方向:花生栽培与育种。通信地址:650221 云南省昆明市盘龙区北京路2238号云南省农业科学院经济作物研究所,Tel:18586839965,E-mail:

  • 基金资助:
    国家花生产业技术体系云南综合试验站建设(CARS-13); 云南省重大科技专项计划项目“食用油料作物(油菜、花生)优质品种选育及高效技术示范”(202102AE090002)

Correlation Analysis Between Sucrose Content in Peanuts and Meteorological Factors and Quality Traits

HE Liu1,2(), YUAN Xiaoyan1, ZHANG Yusong1, LIU Lijing3, ZHONG Liqiong4, ZHAO Kaiqin1, ZHANG Lifan1, HE Xiaoying1, FU Minglian1()   

  1. 1 Industrial Crops Research Institute, Yunnan Academy of Agricultural Sciences, Kunming 650205
    2 College of Agronomy, Yunnan University, Kunming 650500
    3 Yunnan Daiyu Agricultural Technology Co., Ltd, Kunming 650051
    4 Yangjie Town Agricultural and Rural Development Service Center of Xundian Hui and Yi Autonomous County, Kunming 655209
  • Received:2024-03-12 Revised:2024-06-15 Published:2025-01-20 Online:2025-01-20

摘要:

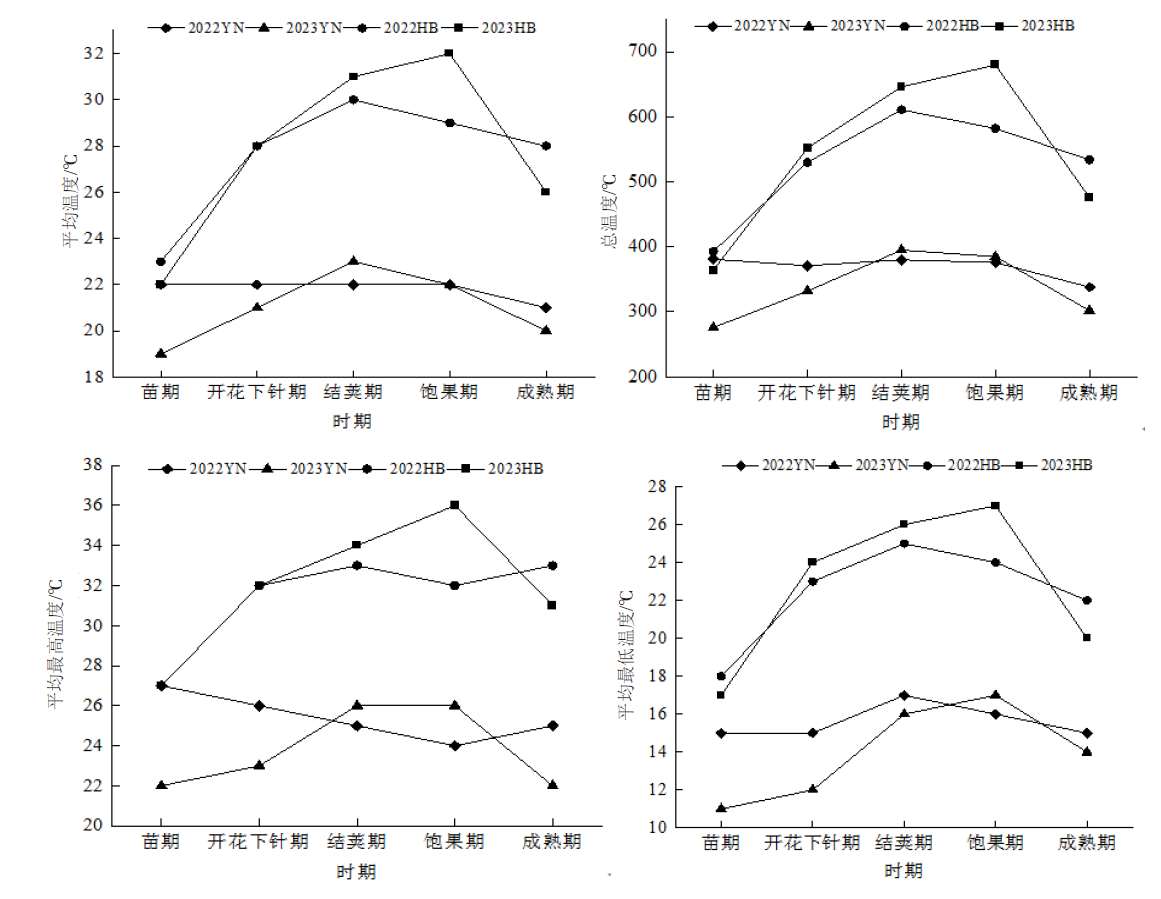
为探究花生蔗糖含量与气象因素及含油量等品质性状的相关性,以中国农业科学院油料作物研究所引进的400份花生种质资源为试验材料,于2022、2023年连续2年分别在湖北武汉(温暖区)和云南昆明(冷凉区)试验田开展试验,通过采集田间农艺、产量数据和气象资料,用Perten DA7250近红外光谱仪品质分析,用简单比较、相关性分析及灰色关联度分析评价蔗糖含量差异。结果显示,参试材料在冷凉区、温暖区平均蔗糖含量分别为5.823%和1.908%,花生籽仁蔗糖含量与生长期间的温度密切相关,与结荚期的平均最高温度呈显著负相关,与开花期至成熟期的平均最低温度、平均气温和≥10℃积温呈显著负相关,灰色关联度平均最高温度>平均最低温度>平均气温>积温,蔗糖含量与含油量呈显著负相关。冷凉区和温暖区平均蔗糖含量相差3.915%。研究发现,花生蔗糖含量受生育期内平均最高温度和平均最低温度影响大,且温度越高越不利于籽仁蔗糖积累,冷凉生境更有利于发展高蔗糖含量食用花生种质。降低花生品种的含油量可能有助于提高花生的蔗糖含量。试验还从400份供试种质中筛选出W26、W172、W225、W239、W251、W377和W411等7份高蔗糖含量的种质。研究旨在为培育优质特色食用花生品种提供种质资源及理论基础,为优质食用花生生产选择最优栽培条件提供参考。

关键词: 花生, 蔗糖含量, 气象因素, 相关性分析, 灰色关联度分析

Abstract:

In order to explore the correlation between peanut sucrose content and meteorological factors and quality traits such as oil, protein, oleic acid and linoleic acid content, the experimental materials were planted in the warm and cold areas for two consecutive years, and field agronomic date, yield data and meteorological data were collected. The quality of the test materials was analyzed by Perten DA7250 near-infrared spectrometer. The difference of sucrose content was evaluated by simple comparison, correlation analysis and grey correlation analysis. The average sucrose contents of the experimental materials in the cold and warm areas were 5.823% and 1.908%, respectively. The sucrose contents of W26, W172, W225, W239, W251, W377 and W411 germplasm were >2.5% in the warm region and >6% in the cold region. The sucrose content of peanut seed kernel was closely related to the temperature during the growth period, and was significantly negatively correlated with the average maximum temperature at the podding stage, and was significantly negatively correlated with the average minimum temperature, average temperature and≥10℃ accumulated temperature from the flowering stage to the maturity stage. The results of grey correlation analysis showed that the factors affecting sucrose content were average maximum temperature > average minimum temperature > average temperature > accumulated temperature. There was a significant negative correlation between sucrose content and oil content. The average sucrose content in the cold and warm areas differed by 3.915 %. The sucrose content of peanut is greatly affected by high temperature during the growth period. Low temperature is more conducive to the accumulation of sucrose content in peanut kernels. Reducing the oil content of peanut varieties may help to increase the sucrose content of peanuts. And seven germplasms with high sucrose content in different habitats were screened out.

Key words: peanut, sucrose content, meteorological factors, correlation analysis, grey correlation analysis