欢迎访问《中国农学通报》,

中国农学通报 ›› 2023, Vol. 39 ›› Issue (32): 138-144.doi: 10.11924/j.issn.1000-6850.casb2022-0852

• 资源·环境·生态·土壤·气象 • 上一篇    下一篇

气候变化对山西省有效积温时空演变的影响

候启1(), 李帅2(), 赵玉洁1, 崔广署1   

  1. 1 日照市气象局,山东日照 276800
    2 中国科学院新疆生态与地理研究所,乌鲁木齐 830011
  • 收稿日期:2022-10-08 修回日期:2022-12-07 出版日期:2023-11-15 发布日期:2023-11-10
  • 通讯作者: 李帅,男,1994年出生,江苏徐州人,在读博士,主要从事区域环境与资源开发方面的研究。通信地址:830011 新疆维吾尔自治区乌鲁木齐市新市区北京南路科学二街305号 生地所实验楼,E-mail:nwnulishuai@163.com。
  • 作者简介:

    候启,男,1994年出生,山西阳泉人,助理工程师,研究生,主要从事气候变化与地表过程研究。通信地址:276800 山东省日照市东港区山东路687号 日照市气象局,E-mail:

  • 基金资助:
    山东省气象防灾减灾重点实验室·青年专项项目(2021SDQN13)

Influence of Climate Change on the Spatial and Temporal Evolution of Effective Accumulated Temperature in Shanxi Province

HOU Qi1(), LI Shuai2(), ZHAO Yujie1, CUI Guangshu1   

  1. 1 Rizhao Meteorological Bureau, Rizhao, Shandong 276800
    2 Xinjiang Institute of Ecology and Geography, Chinese Academy of Sciences, Urumqi 830011
  • Received:2022-10-08 Revised:2022-12-07 Published-:2023-11-15 Online:2023-11-10

摘要:

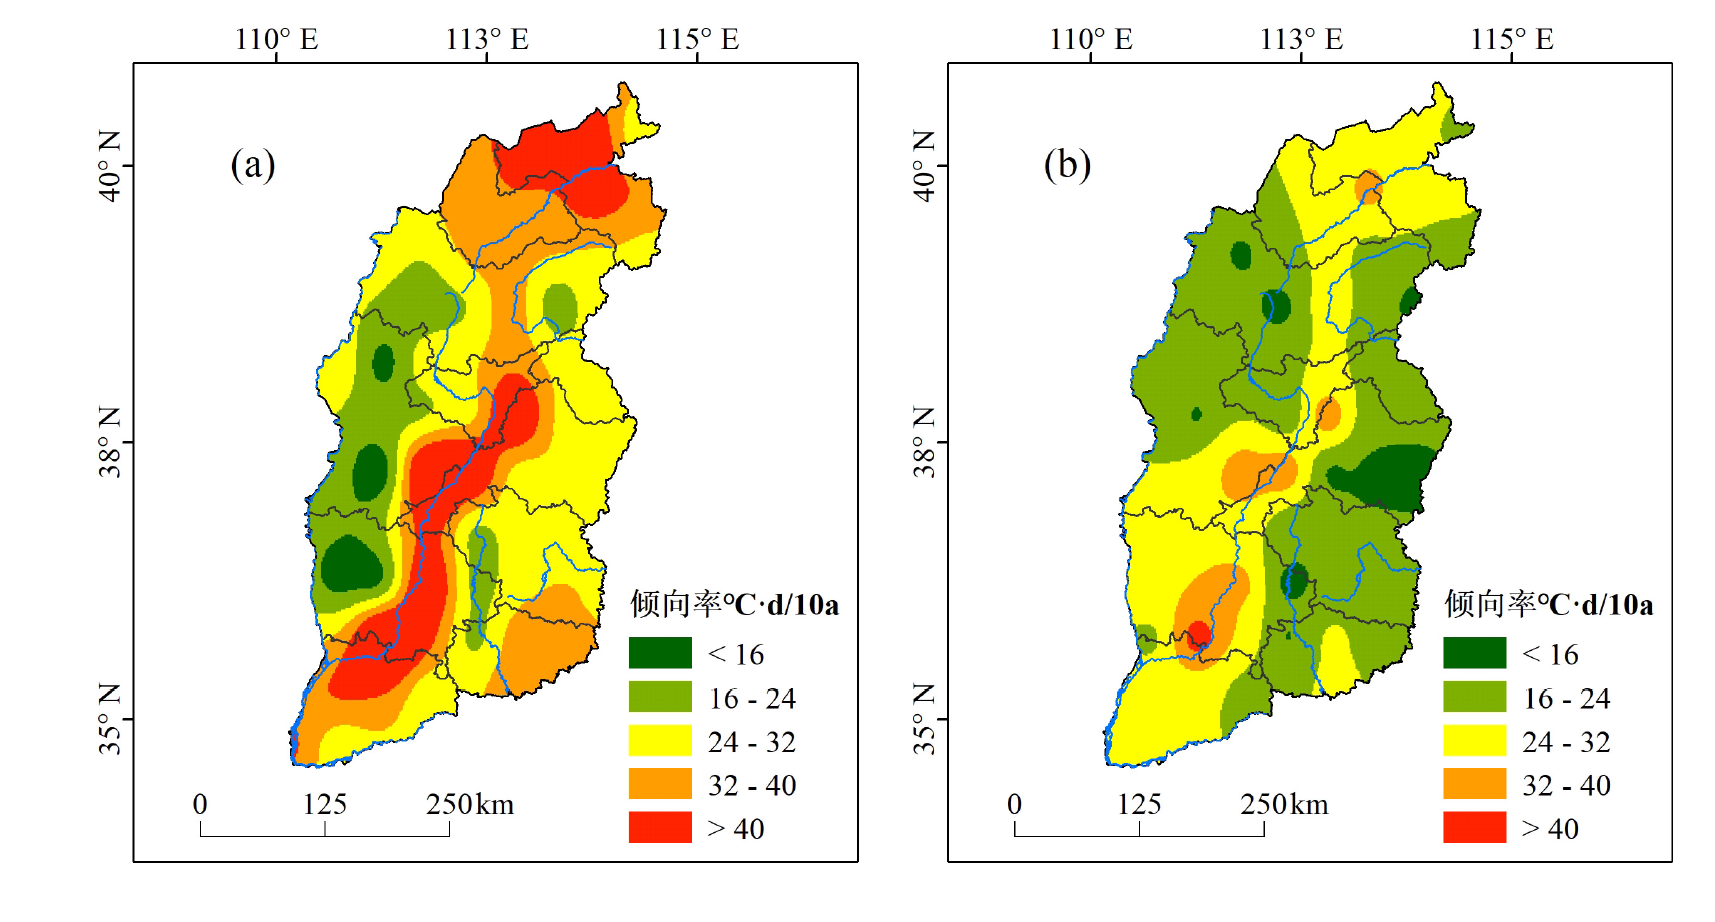
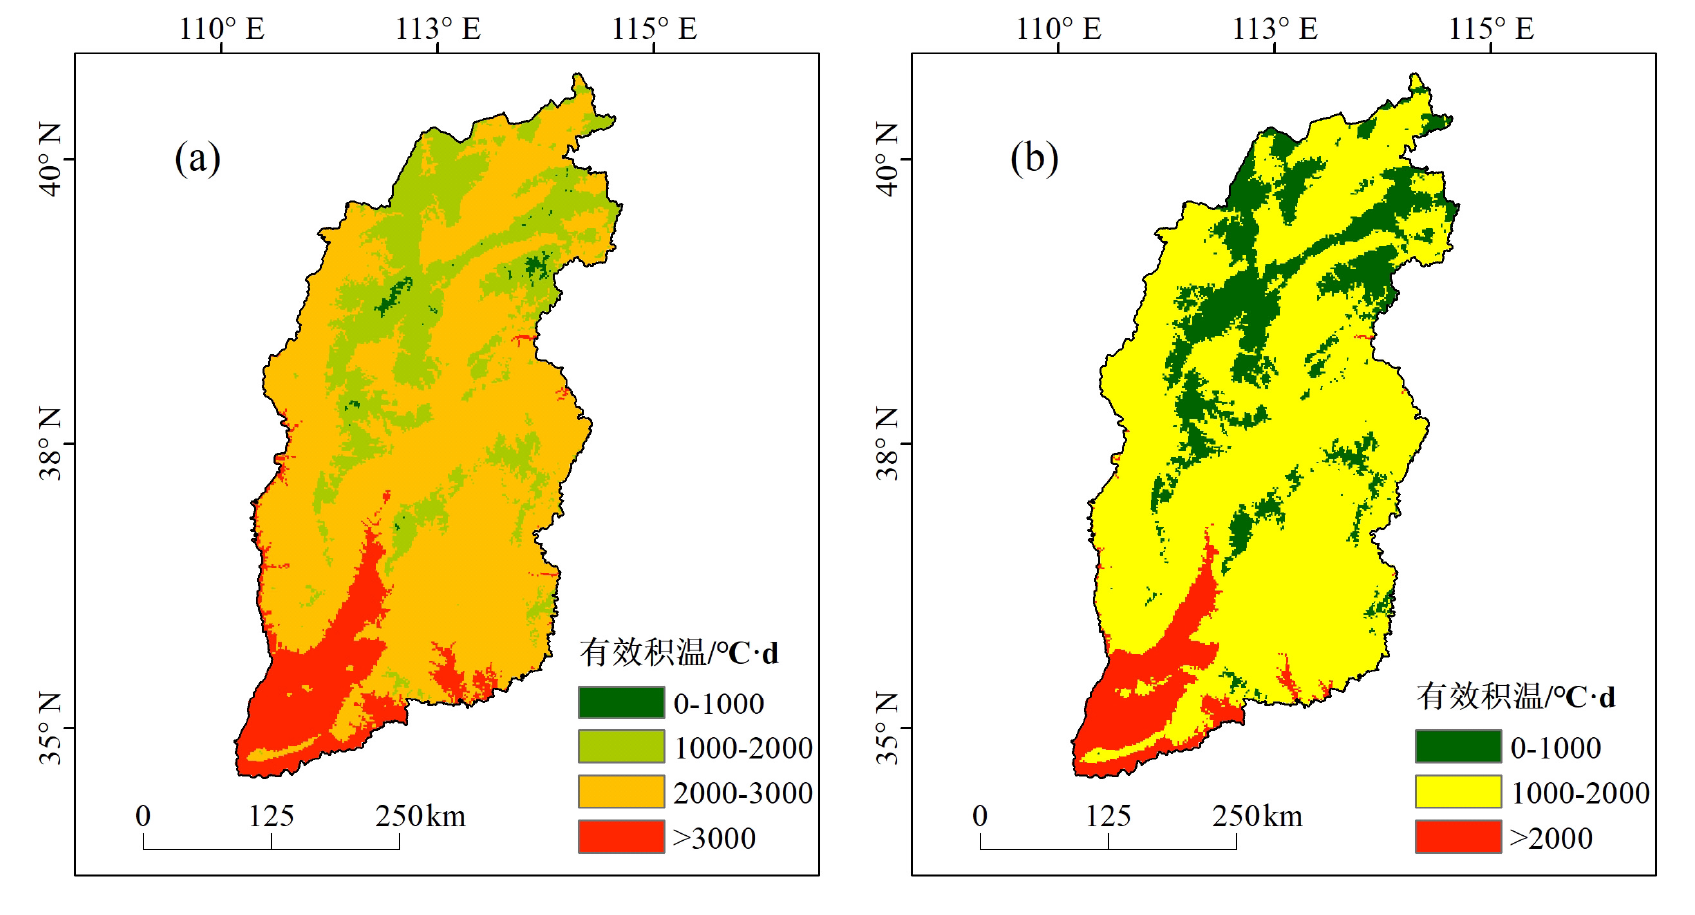
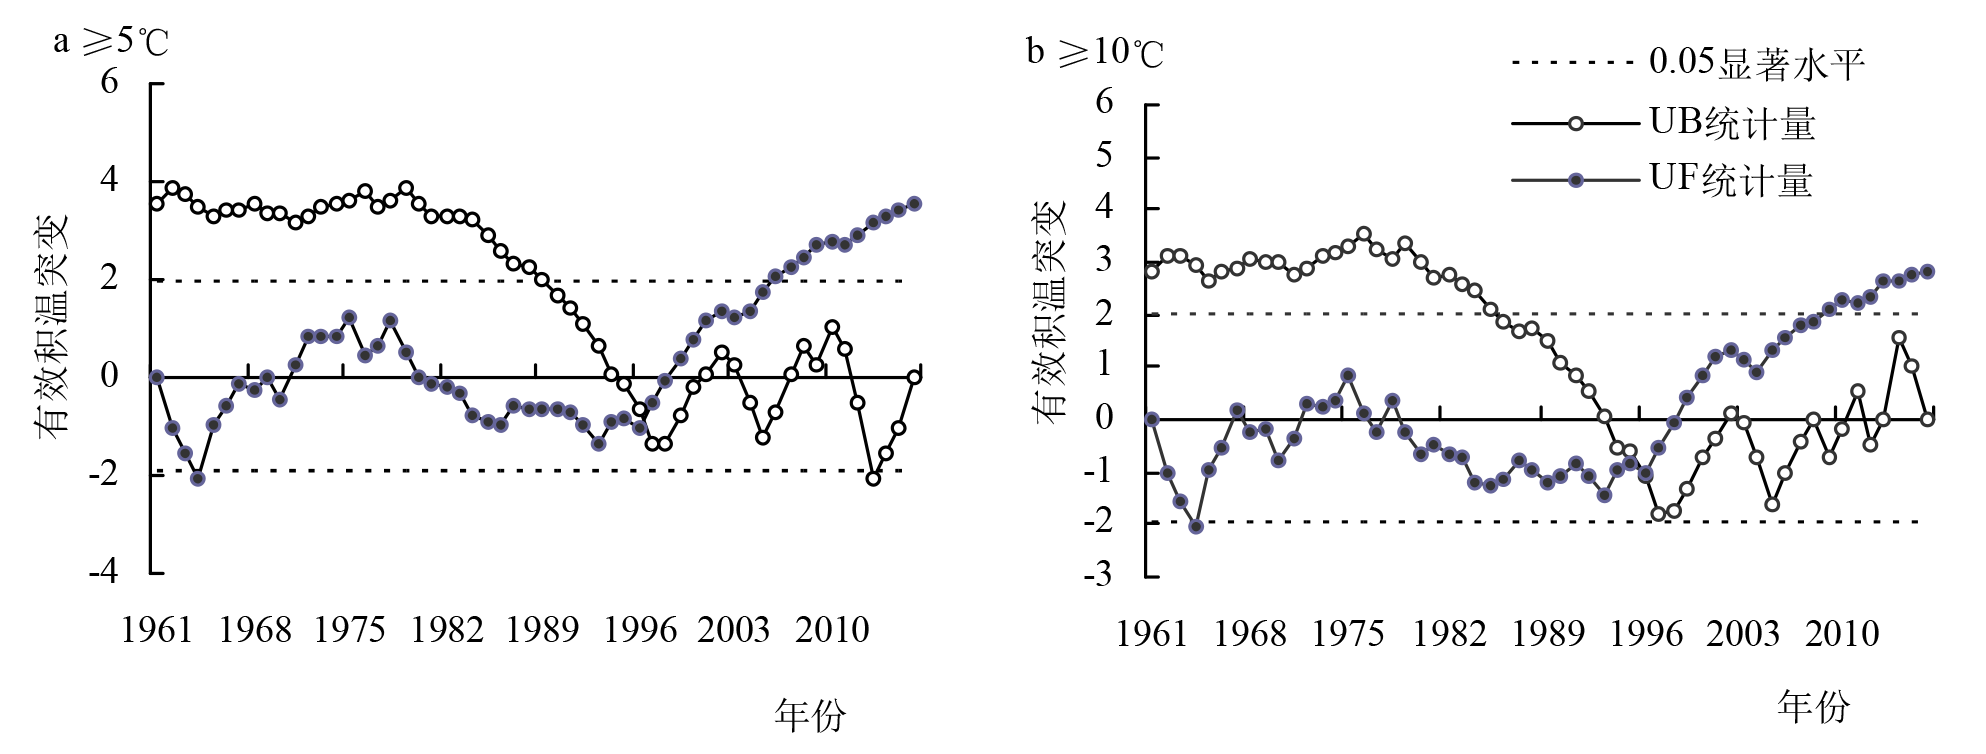
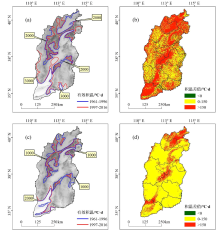
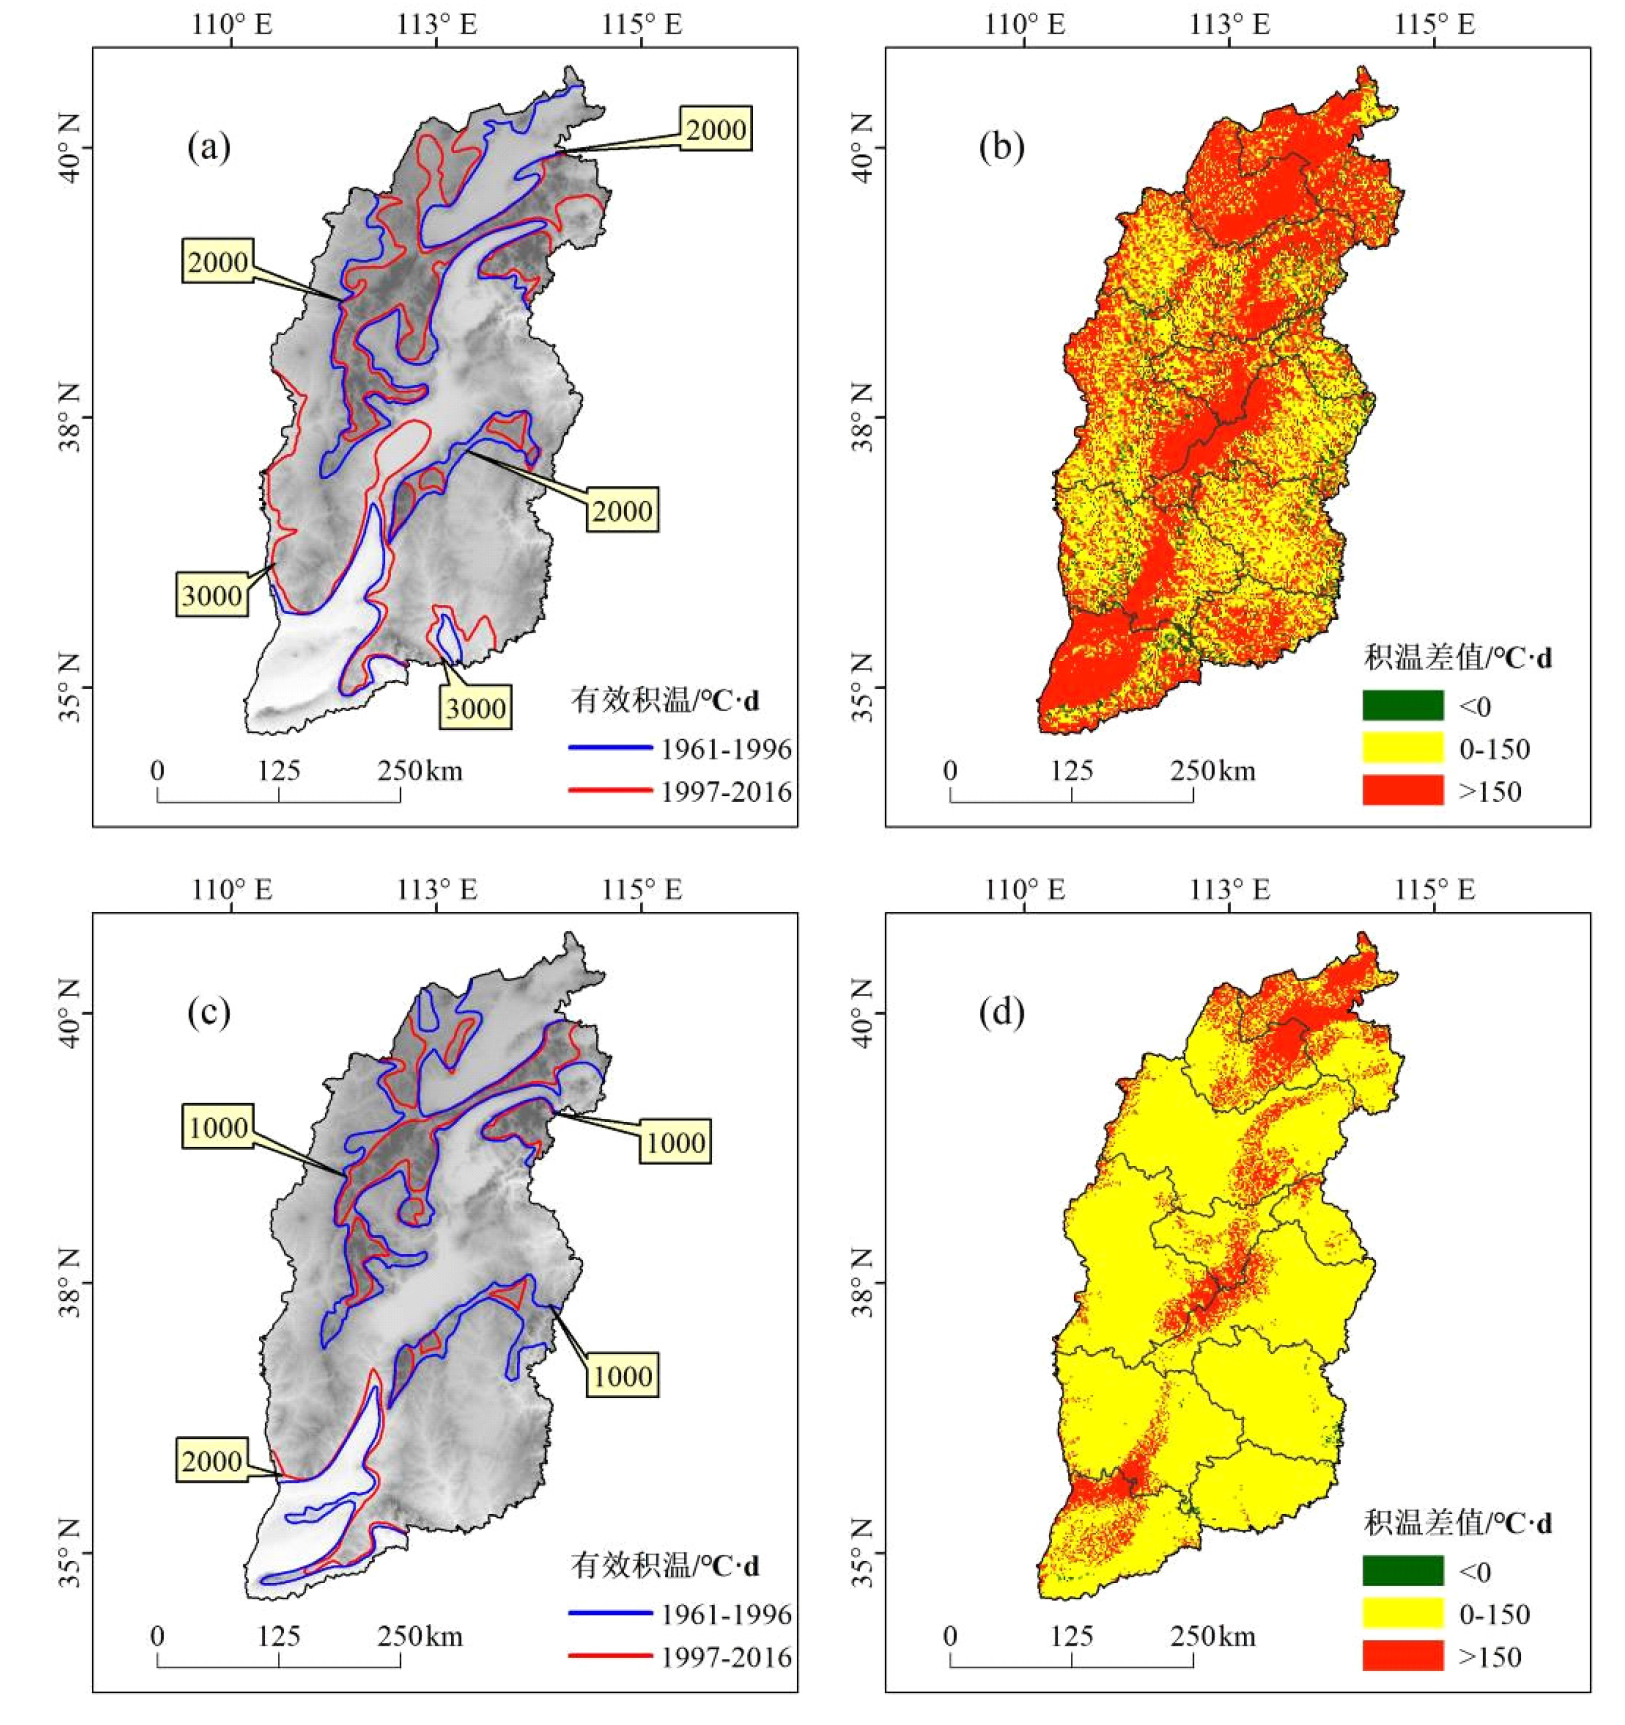
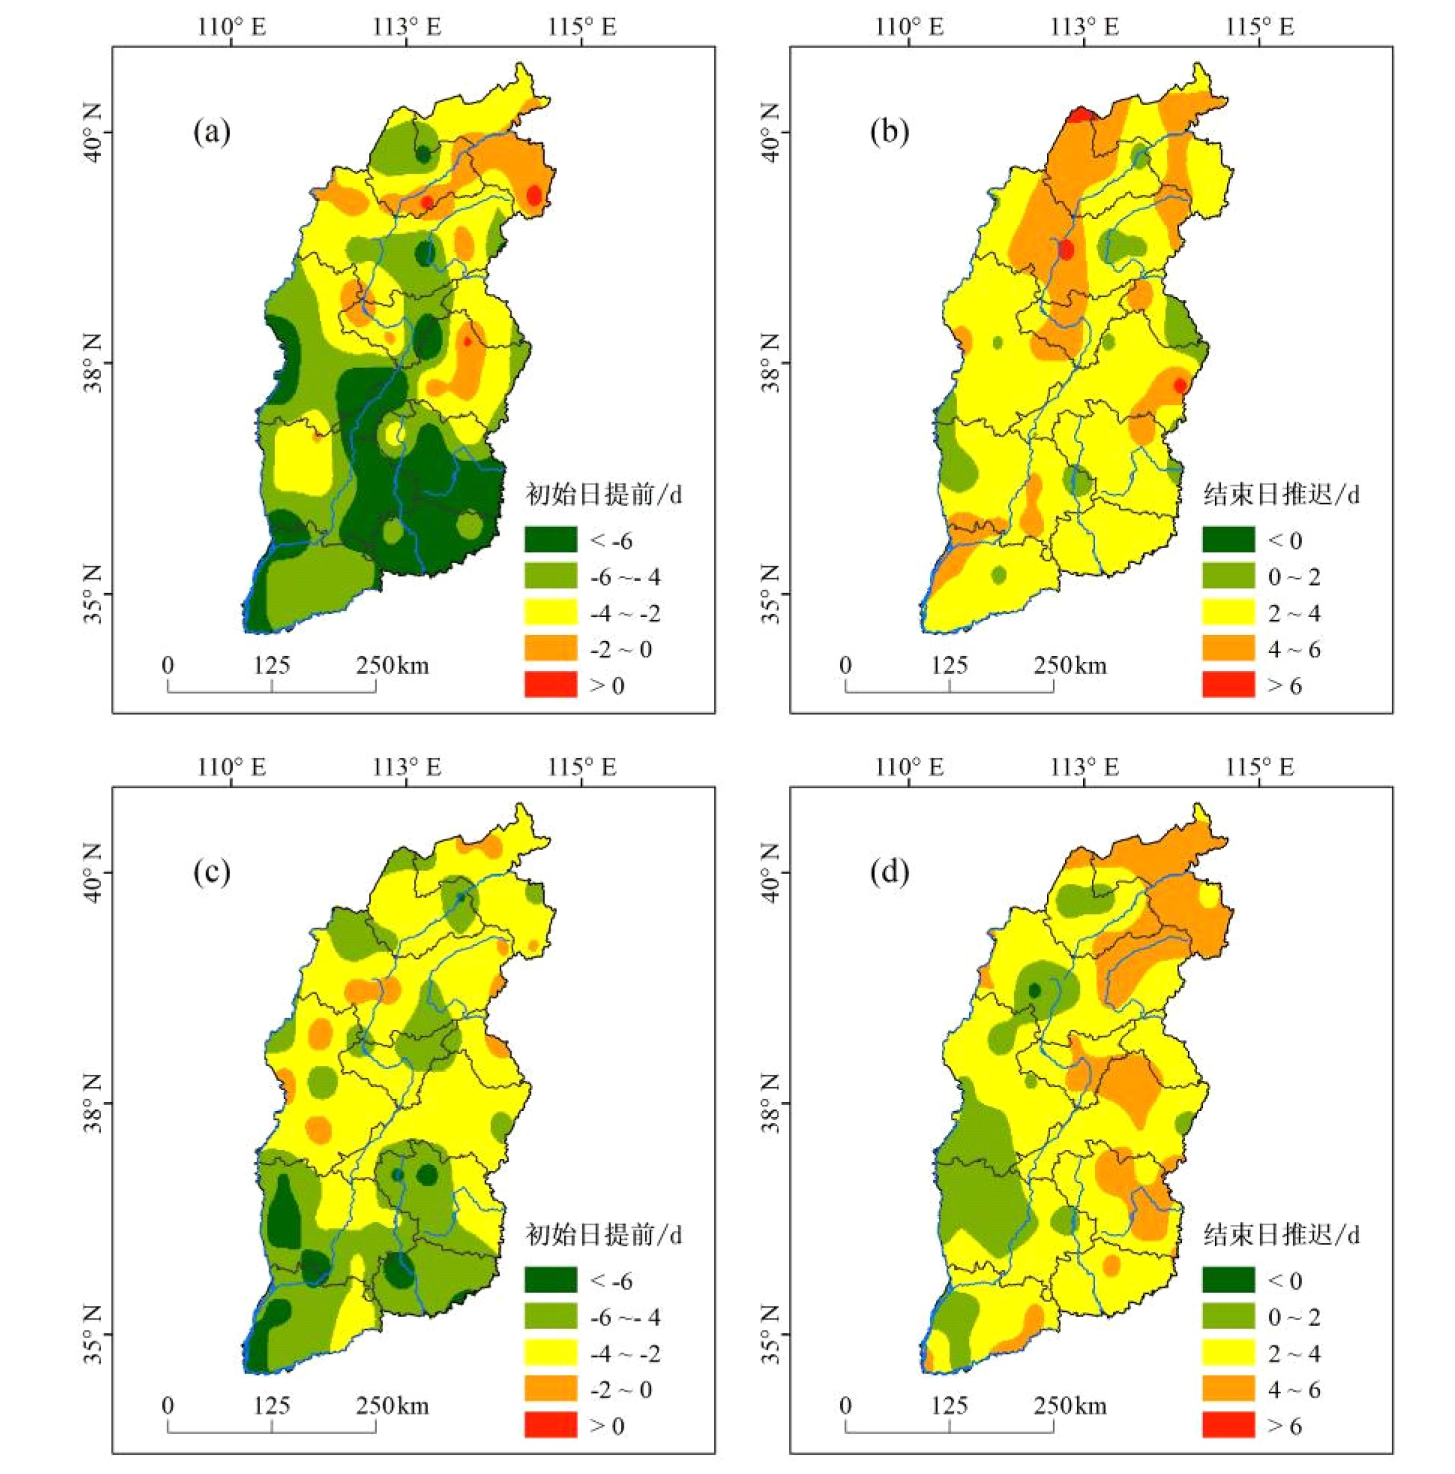
为了解气候变化对山西省农作物种植的影响,本文基于1961—2016年气温格点数据,利用Mann-Kendall趋势/突变检验、变异系数和多元回归插值法对山西省≥5℃、≥10℃有效积温进行分析。结果表明:(1)1961—2016年≥5℃和≥10℃有效积温均呈明显的升高趋势,有效积温升温较快的区域主要分布在山西省北部和地势较低的谷地、盆地,由东北向西南呈带状分布。(2)≥5℃和≥10℃有效积温在空间分布上表现出自南向北逐渐减少的趋势,且其在空间分布上受海拔影响较大。≥5℃有效积温在适宜作物生长的积温范围分布面积更大,在大多数地区更适宜喜凉作物的种植。(3)≥5℃和≥10℃有效积温均在1997年发生突变,突变后积温界限北界向高纬和高海拔地区移动。(4)≥5℃和≥10℃有效积温初始日期多呈提前趋势,结束日期多为推后趋势;积温持续日期增长,这种趋势在山西省南部及河谷、盆地地区更为明显;有效积温初始日期变异系数均由东北向西南逐渐增大,汾河谷地有效积温初始日期变率较大;结束日期的变异系数较小,分布更为稳定。

关键词: 有效积温, 热量资源, 变化特征, 多元回归插值, 对比分析, 山西省

Abstract:

To understand the impact of climate change on crop planting in Shanxi Province, based on the temperature grid data from 1961 to 2016, this paper used Mann-Kendall trend/mutation test, coefficient of variation and multiple regression interpolation method to analyze the effective accumulated temperature ≥5℃ and ≥10℃ in Shanxi Province. The results showed that: (1) the effective accumulated temperature of both ≥5℃ and ≥10℃ showed obvious increasing trends in time distribution, and the effective accumulated temperature increased rapidly in northern Shanxi Province and the valleys and basins with low terrain, and the spatial distribution was zonal from northeast to southwest. (2) The effective accumulated temperature of ≥5℃ and ≥10℃ showed decreasing trends from south to north in spatial distribution, and its spatial distribution was greatly affected by altitude. The effective accumulated temperature of ≥5℃ had a larger distribution area in the accumulated temperature range suitable for crop growth, and was more suitable for cold-loving crop cultivation in most areas. (3) The effective accumulated temperature was abruptly changed in 1997, after the change, the northern boundary of accumulated temperature moved to high latitude and high altitude areas. (4) The effective accumulated temperature initial date was mostly advanced, and the end date tended to be delayed. The duration of effective accumulated temperature was extended, and this trend was more obvious in the south of Shanxi Province, valleys and basins. The coefficient of variation of the effective accumulated temperature start date increased from northeast to southwest, and the rate of variation of the initial date of Fenhe Valley was large; the coefficient of variation of the end date was smaller and the distribution was more stable.

Key words: effective accumulative temperature, heat resources, variation characteristics, multiple regression interpolation, comparative analysis, Shanxi Province