欢迎访问《中国农学通报》,

中国农学通报 ›› 2023, Vol. 39 ›› Issue (14): 80-84.doi: 10.11924/j.issn.1000-6850.casb2022-0525

• 资源·环境·生态·土壤·气象 • 上一篇    下一篇

1991—2020年内蒙古兴安盟热量资源变化特征及区划

张晓磊(), 高红霞(), 刘洋   

  1. 兴安盟气象局,内蒙古乌兰浩特 137400
  • 收稿日期:2022-06-21 修回日期:2022-08-16 出版日期:2023-05-09 发布日期:2023-05-09
  • 作者简介:

    张晓磊,男,1986年出生,内蒙古赤峰人,工程师,硕士,主要从事气象信息自动监测方面的研究。通信地址:137400 内蒙古乌兰浩特市铁西北大路46号,Tel:0482-8317137,E-mail:

  • 基金资助:
    内蒙古自然科学基金项目“内蒙古马铃薯气象灾害精细化预报及风险评估技术研究”(2018MS03003)

Variation Characteristics and Zoning of Heat Resource in Xing’an League of Inner Mongolia from 1991 to 2020

ZHANG Xiaolei(), GAO Hongxia(), LIU Yang   

  1. Xing’an League Meteorological Bureau, Ulanhot, Inner Mongolia 137400
  • Received:2022-06-21 Revised:2022-08-16 Online:2023-05-09 Published:2023-05-09

摘要:

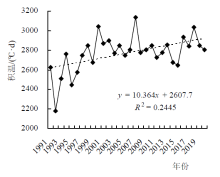
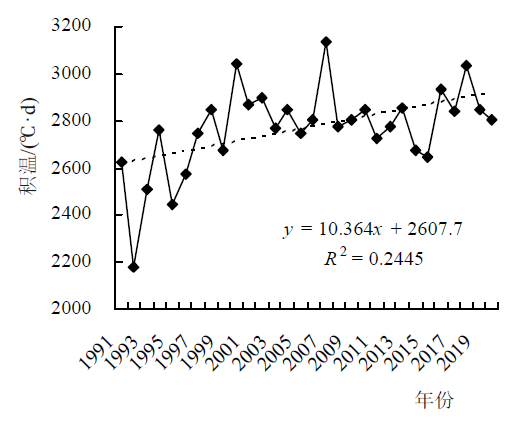
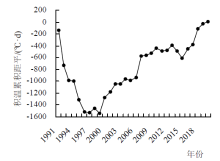
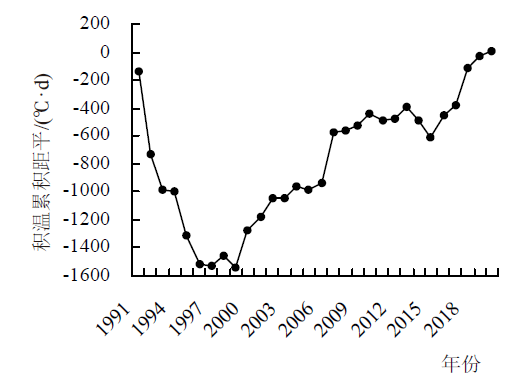
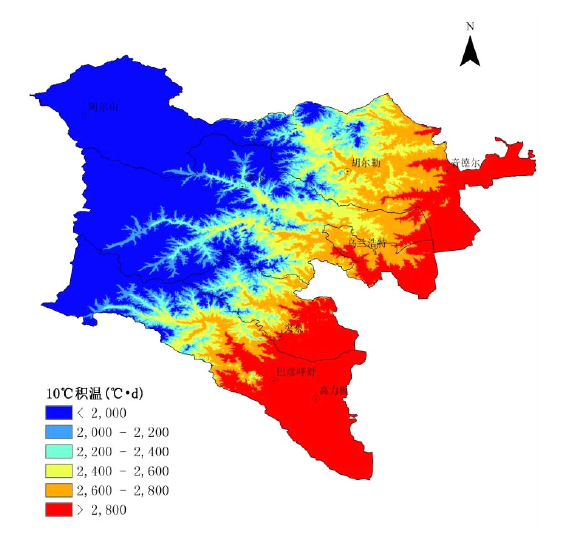
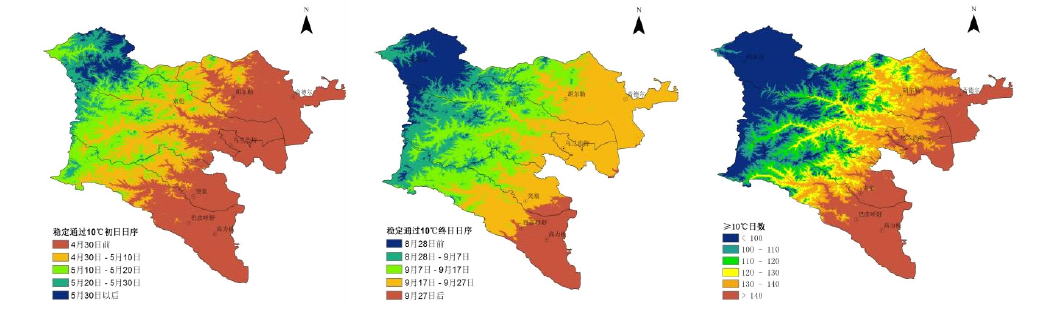
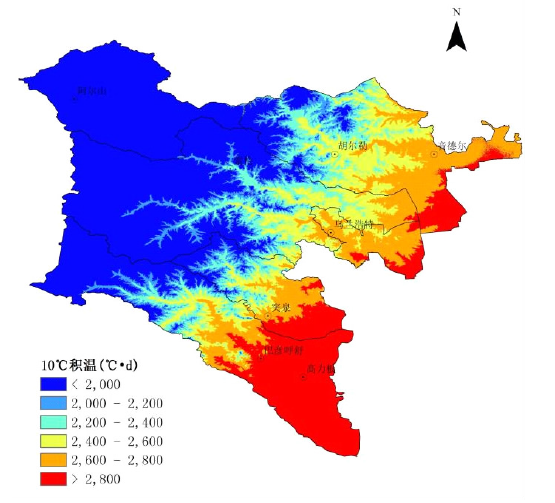
利用内蒙古兴安盟8个国家气象观测站1991—2020年的日平均气温数据,对兴安盟30年间10℃活动积温变化特征进行了分析,同时,结合周边呼伦贝尔市、通辽市、吉林省10个气象观测站同时间段日平均气温数据,构建了兴安盟10℃活动积温、稳定通过10℃初终日及持续日数的精细化推算模型,最后,结合兴安盟地理信息数据绘制了热量资源精细化区划图。结果表明:1991—2020年兴安盟10℃平均活动积温气候倾向率为103.64 (℃·d)/10 a,呈显著增加趋势,其变化大致可以分为4个特征明显的阶段。与上一代际相比,1991—2020年各站点10℃活动积温平均值均有所增加,≥2800℃·d区域所占面积约增加5553 km2,其他等级10℃积温区域面积均不同程度减少,各等级区域边界均向西北移动。

关键词: 气候变暖, 热量资源, 活动积温, 区划, 兴安盟

Abstract:

Based on the daily average temperature data of 8 meteorological observation stations in Xing’an League of Inner Mongolia from 1991 to 2020, this paper analyzed the variation characteristics of 10℃ active accumulated temperature in Xing’an League during the 30 years. At the same time, combined with the daily average temperature data of 10 meteorological observation stations in Hulunbeier City, Tongliao City and Jilin Province, the refined calculation model of each heat element in Xing’an League was constructed. Finally, combined with the geographic information data of Xing’an League, the refined zoning map of heat resource was drawn. The results showed that the climate tendency rate of the 10℃ average active accumulated temperature in Xing’an League from 1991 to 2020 was 103.64 (℃·d)/10 a. Its change could be roughly divided into four stages. Compared with the previous generation, the average value of 10℃ active accumulated temperature at each station increased from 1991 to 2020. The area of ≥2800℃·d increased by about 5553 km2, and the area of 10℃ active accumulated temperature at other levels decreased in varying degrees, and the boundary of 10℃ active accumulated temperature of each grade moved to the northwest.

Key words: climate warming, heat resource, active accumulated temperature, zoning, Xing’an League