欢迎访问《中国农学通报》,
中国农学通报 ›› 2020, Vol. 36 ›› Issue (18): 134-140.doi: 10.11924/j.issn.1000-6850.casb19030024
所属专题: 小麦
李晓航1,2, 盛坤1,2( )
)
收稿日期:2019-03-06
修回日期:2019-06-19
出版日期:2020-06-25
发布日期:2020-07-10
通讯作者:
盛坤
作者简介:李晓航,女,1987年出生,河南安阳人,助理研究员,硕士,主要从事小麦节水育种栽培的研究。通信地址:450000 河南省新乡市红旗区新二街518号,Tel:0373-6202008,E-mail: 410733138@qq.com。
基金资助:
Li Xiaohang1,2, Sheng Kun1,2()
Received:2019-03-06
Revised:2019-06-19
Online:2020-06-25
Published:2020-07-10
Contact:
Sheng Kun
摘要:
该试验探讨了黄淮地区不同年份之间冬小麦品质指标的波动趋势,分析结论可为该地区小麦品质提升和品种产业化应用提供理论参考。经过分析2011—2015年中国黄淮地区南、北片国家区试水地组的317个小麦品种的籽粒粗蛋白含量、湿面筋含量、面团稳定时间、沉降值和最大拉伸阻力等一系列相关品质指标。结果得出:2013年黄淮地区南、北片的小麦平均粗蛋白含量、湿面筋含量高于其他年份,但是稳定时间却不是最大。综合比较不同年份小麦品质指标的变异大小,以容重最小,稳定时间最大。变异程度较为接近的是蛋白质和湿面筋含量,但是稳定时间的变异约为前两者的20倍以上。根据品质指标含量进行分类,强筋、弱筋和中筋品种分别占有比例为3.15%、0%和22.7%,其余未归类品种所占比例高达74.14%。
中图分类号:
李晓航, 盛坤. 2011—2015年黄淮麦区小麦品种品质分析[J]. 中国农学通报, 2020, 36(18): 134-140.
Li Xiaohang, Sheng Kun. Wheat Quality in Huang-huai Wheat Region from 2011 to 2015[J]. Chinese Agricultural Science Bulletin, 2020, 36(18): 134-140.
| 年份 | 区组 | 籽粒容重/ (g/L) | 粗蛋白含量/ % | 湿面筋/ % | 沉降值/ mL | 吸水量/ (mL/100 g) | 面团稳定时间/ min | 最大拉伸阻力/ E.U. | 延展性/ mm | ||||||||||
|---|---|---|---|---|---|---|---|---|---|---|---|---|---|---|---|---|---|---|---|
| 2010 — 2011 | 黄淮南片 n=33 | 均值 | 801.03 | 13.77 | 29.63 | 29.11 | 56.33 | 5.30 | 259.82 | 145.09 | |||||||||
| CV/% | 1.54 | 4.56 | 7.20 | 19.06 | 4.92 | 67.01 | 47.08 | 11.91 | |||||||||||
| 变幅 | 766~818 | 12.38~15.03 | 25.3~34.2 | 18.3~41.7 | 50.9~60.8 | 1.6~15.2 | 104~586 | 106~174 | |||||||||||
| PR/% | 6.79 | 21.41 | 35.18 | 127.87 | 19.45 | 850.00 | 463.46 | 64.15 | |||||||||||
| 黄淮北片 n=19 | 均值 | 806.63 | 13.73 | 29.54 | 24.59 | 56.25 | 3.98 | 209.37 | 156.89 | ||||||||||
| CV/% | 1.19 | 5.28 | 5.96 | 26.03 | 13.28 | 82.54 | 60.67 | 43.95 | |||||||||||
| 变幅 | 792~825 | 12.44~15.56 | 26.1~32.7 | 13.9~40.9 | 26.9~62 | 0.6~15.4 | 86~552 | 78~418 | |||||||||||
| PR/% | 4.17 | 25.08 | 25.29 | 194.24 | 130.48 | 2466.67 | 541.86 | 435.90 | |||||||||||
| 2011 — 2012 | 黄淮南片 n=40 | 均值 | 800.23 | 14.60 | 32.17 | 32.98 | 56.05 | 5.92 | 304.95 | 157.28 | |||||||||
| CV/% | 1.48 | 3.88 | 5.63 | 19.61 | 4.14 | 82.03 | 51.12 | 11.29 | |||||||||||
| 变幅 | 781~820 | 13.36~16.08 | 29~35.7 | 19.9~49.7 | 50.6~59.6 | 1~25.3 | 110~800 | 119~184 | |||||||||||
| PR/% | 4.99 | 27.20 | 23.10 | 149.75 | 17.79 | 2430.00 | 627.27 | 54.62 | |||||||||||
| 黄淮北片 n=20 | 均值 | 814.60 | 13.84 | 30.23 | 32.78 | 56.66 | 5.18 | 285.25 | 145.70 | ||||||||||
| CV/% | 1.54 | 6.70 | 7.44 | 27.43 | 10.99 | 74.47 | 44.59 | 11.70 | |||||||||||
| 变幅 | 785~832 | 12.29~15.88 | 26.5~34 | 21.4~58.8 | 33.4~61.4 | 1.4~19.7 | 118~444 | 116~178 | |||||||||||
| PR/% | 5.99 | 29.21 | 28.30 | 174.77 | 83.83 | 1307.14 | 276.27 | 53.45 | |||||||||||
| 2012 — 2013 | 黄淮南片 n=39 | 均值 | 794.23 | 15.21 | 32.47 | 35.26 | 55.36 | 5.12 | 314.90 | 161.18 | |||||||||
| CV/% | 1.32 | 3.77 | 4.36 | 19.80 | 4.43 | 70.05 | 53.20 | 11.61 | |||||||||||
| 变幅 | 770~811 | 14.06~16.12 | 29.1~34.9 | 22.1~51.4 | 51~59.2 | 1.2~16.6 | 139~792 | 128~201 | |||||||||||
| PR/% | 5.32 | 14.65 | 19.93 | 132.58 | 16.08 | 1283.33 | 469.78 | 57.03 | |||||||||||
| 黄淮北片 n=19 | 均值 | 781.37 | 15.17 | 32.33 | 34.03 | 57.24 | 5.34 | 295.68 | 160.37 | ||||||||||
| CV/% | 1.69 | 3.84 | 5.73 | 22.36 | 2.62 | 66.94 | 53.14 | 15.92 | |||||||||||
| 变幅 | 750~802 | 14.14~16.06 | 29.5~36.9 | 19.8~45.4 | 53.4~59.5 | 1.8~13.7 | 110~589 | 130~210 | |||||||||||
| PR/% | 6.93 | 13.58 | 25.08 | 129.29 | 11.42 | 661.11 | 435.45 | 61.54 | |||||||||||
| 2013 — 2014 | 黄淮南片 n=41 | 均值 | 805.73 | 14.18 | 31.45 | 27.43 | 59.16 | 3.35 | 212.73 | 156.22 | |||||||||
| CV/% | 1.42 | 4.10 | 6.14 | 21.48 | 4.20 | 62.23 | 51.49 | 12.10 | |||||||||||
| 变幅 | 780~834 | 12.9~15.31 | 28.5~35.3 | 17.1~39.4 | 53.2~63.2 | 1.1~9.2 | 101~578 | 105~204 | |||||||||||
| PR/% | 6.92 | 18.60 | 23.86 | 130.41 | 18.80 | 736.36 | 472.28 | 94.29 | |||||||||||
| 黄淮北片 n=26 | 均值 | 814.00 | 13.76 | 29.58 | 26.05 | 57.60 | 3.37 | 207.35 | 156.81 | ||||||||||
| CV/% | 1.84 | 5.25 | 6.44 | 31.81 | 13.13 | 50.68 | 42.38 | 34.89 | |||||||||||
| 变幅 | 770~828 | 12.8~15.8 | 26.6~32.8 | 13.7~55.7 | 23.7~62.3 | 0.7~6.1 | 98~426 | 110~410 | |||||||||||
| PR/% | 7.53 | 23.44 | 23.31 | 306.57 | 162.87 | 771.43 | 334.69 | 272.73 | |||||||||||
| 2014 — 2015 | 黄淮南片 n=57 | 均值 | 809.72 | 14.50 | 30.17 | 30.69 | 56.81 | 4.88 | 202.44 | 163.89 | |||||||||
| CV/% | 1.57 | 5.24 | 7.70 | 19.92 | 12.80 | 59.02 | 53.63 | 13.75 | |||||||||||
| 变幅 | 774~842 | 12.87~15.99 | 25.8~34.2 | 14.4~41.3 | 51.5~65.2 | 1.6~18.6 | 59~442 | 116~224 | |||||||||||
| PR/% | 8.79 | 24.24 | 32.56 | 186.81 | 26.60 | 1062.50 | 649.15 | 93.10 | |||||||||||
| 黄淮北片 n=23 | 均值 | 825.57 | 13.99 | 29.30 | 32.07 | 57.03 | 5.11 | 283.30 | 147.96 | ||||||||||
| CV/% | 2.97 | 6.53 | 7.39 | 29.25 | 16.84 | 60.00 | 42.02 | 10.38 | |||||||||||
| 变幅 | 807~931 | 12.79~16.56 | 26.3~32.2 | 19.5~61.1 | 23.6~62.3 | 1.1~14.5 | 112~654 | 119~169 | |||||||||||
| PR/% | 15.37 | 29.48 | 22.43 | 213.33 | 163.98 | 1218.18 | 483.93 | 42.02 | |||||||||||
| 合计 n=317 | 均值 | 805.12 | 14.34 | 30.80 | 30.64 | 56.85 | 4.77 | 254.01 | 156.26 | ||||||||||
| CV/% | 2.06 | 5.94 | 7.41 | 24.68 | 9.64 | 71.35 | 53.42 | 18.82 | |||||||||||
| 变幅 | 750~931 | 12.29~16.56 | 25.3~36.9 | 13.7~61.1 | 23.6~65.2 | 0.6~19.7 | 59~800 | 78~418 | |||||||||||
| PR/% | 24.13 | 34.74 | 45.85 | 345.99 | 176.27 | 3183.33 | 1255.93 | 435.90 | |||||||||||

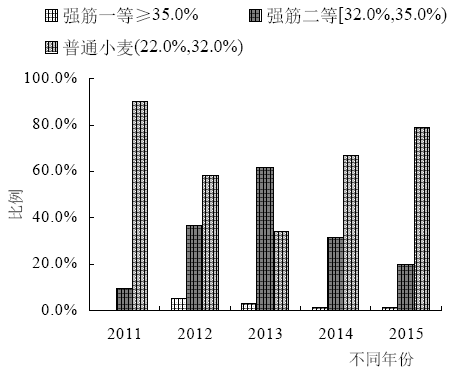

| 年份 | 参试品种数 | 强筋小麦 | 中筋小麦 | 弱筋小麦 | 其他 | |||||||
|---|---|---|---|---|---|---|---|---|---|---|---|---|
| 个数 | 比例/% | 个数 | 比例/% | 个数 | 比例/% | 个数 | 比例/% | |||||
| 2011 | 52 | 0 | 0.00 | 23 | 44.23 | 0 | 0.00 | 29 | 55.77 | |||
| 2012 | 60 | 2 | 3.33 | 13 | 21.67 | 0 | 0.00 | 45 | 75.00 | |||
| 2013 | 58 | 4 | 9.90 | 0 | 0.00 | 0 | 0.00 | 54 | 93.10 | |||
| 2014 | 67 | 1 | 1.49 | 16 | 23.88 | 0 | 0.00 | 50 | 74.63 | |||
| 2015 | 80 | 3 | 3.75 | 20 | 25.00 | 0 | 0.00 | 57 | 71.25 | |||
| 合计 | 317 | 10 | 3.15 | 72 | 22.71 | 0 | 0.00 | 235 | 74.14 | |||
| [1] | 薛辉, 余慷, 马晓玲, 等. 黄淮麦区小麦品种耐倒春寒相关性状的评价及关联分析[J]. 麦类作物学报, 2018,38(10):1174-1188. |
| [2] | 赵虹, 王西成, 胡卫国, 等. 黄淮南片麦区小麦倒春寒冻害成因及预防措施[J]. 河南农业科学, 2014,43(8):34. |
| [3] | 胡学旭, 周桂英, 吴丽娜, 等. 2006-2014年我国小麦品质在年度和品质区之间的变化[J]. 麦类作物学报, 2016,36(3):292-301. |
| [4] | 昝香存, 周桂英, 吴丽娜, 等. 我国小麦品质现状分析[J]. 麦类作物学报, 2006,26(6):46-49. |
| [5] | 王瑞, 张永科, 郭勇, 等. 小麦不同阶段产品品质性状的变异及其关系[J]. 麦类作物学报, 2018,38(8):900-905. |
| [6] | 万富世, 王光瑞. 我国小麦品质现状及其改良目标初探[J]. 中国农业科学, 1989,22(30):14-21. |
| [7] | 黄承彦, 迟斌, 曲辉英, 等. 山东省小麦品种品质状况分析[J]. 山东农业科学, 2004(2):12-15. |
| [8] | Guttier M J, Ahmad R, Stark J C, et al. End use quality of six hard red spring wheat cultivars at different irrigation levels[J]. Crop Science, 2000,40:633. |
| [9] | 马冬云, 郭天财, 王晨阳, 等. 不同麦区小麦品种子粒淀粉糊化特性分析[J]. 华北农学报, 2004,19(4):59-61. |
| [10] | 邢国风, 唐永金. 小麦籽粒性状与产量和品质的数量化关系[J]. 麦类作物学报, 2007,27(3):490. |
| [11] | 魏益民. 谷物品质与食品品质[M]. 西安: 陕西人民出版社, 2002: 20 |
| [12] | 刘路平, 朱传杰, 简俊涛, 等. 黄淮麦区小麦新品种(系)的遗传多样性分析[J]. 麦类作物学报, 2013,33(6):1128-1133. |
| [13] | 吴宏亚, 张晓, 施恰恰, 等. 小麦品质性状相互关系的研究[J]. 扬州大学学报:农业与生命科学版, 2016,37(4):69. |
| [14] | 韩凡香, 常磊, 柴守玺, 等. 2003年—2009年中国旱地小麦品种蛋白质品质分析[J]. 核农学报, 2015,29(4):0717-0723. |
| [15] | 全国农业技术推广服务中心. 中国冬小麦新品种动态—2010-2011年度国家冬小麦品种区试试验汇总报告[R]. 北京: 中国农业科学技术出版社, 2012. |
| [16] | 全国农业技术推广服务中心. 中国冬小麦新品种动态—2011-2012年度国家冬小麦品种区试试验汇总报告[R]. 北京: 中国农业科学技术出版社, 2013. |
| [17] | 全国农业技术推广服务中心. 中国冬小麦新品种动态—2012-2013年度国家冬小麦品种区试试验汇总报告[R]. 北京: 中国农业科学技术出版社, 2014. |
| [18] | 全国农业技术推广服务中心. 国冬小麦新品种动态—2013-2014年度国家冬小麦品种区试试验汇总报告[R]. 北京: 中国农业科学技术出版社, 2015. |
| [19] | 全国农业技术推广服务中心. 2014-2015年度冬小麦国家区试品种报告[R]. 北京: 中国农业科学技术出版社, 2016. |
| [20] | 全国农业技术推广服务中心. NY/T 967–2006 农作物品种审定规范小麦[S]. 北京: 中国标准出版社, 2007. |
| [21] | 张华文, 田纪春, 刘艳玲. 小麦品种间籽粒品质性状表现极及其相关性分析[J]. 山东农业科学, 2004,( 6):10-12,28. |
| [22] | 刘莲, 胡延吉, 田纪春, 等. 山东省小麦籽粒品质性状的演变及相关分析[J]. 种子, 2003(6):12-15,46. |
| [23] | 时侠清, 刘冬成, 孙家柱, 等. 我国北方冬小麦籽粒中的戊聚糖含量及其相关分析[J]. 核农学报, 2006,20(3):225-228. |
| [24] | 张艳, 何中虎, 周桂英, 等. 基因型和环境对我国冬播麦区小麦品质性状的影响[J]. 中国粮油学报, 1999,14(5):1-5. |
| [25] | 胡卫国, 赵虹, 王西成, 等. 黄淮冬麦区小麦品种品质改良现状分析[J]. 麦类作物学报, 2010,30(5) : 936-943. |
| [26] | Rharrabti Y, Villegas D, Royo C, et al. Durum wheat quality in Mediterranean environments: II. Influence of climatic variables and relationships between quality parameters[J]. Field Crops Research, 2003,80(2):133-140. |
| [27] | 关二旗, 魏益民, 张波, 等. 黄淮冬麦区部分区域小麦品种构成及品质性状分析[J]. 中国农业科学, 201245(6):1159-1168. |
| [28] | 阎俊, 何中虎. 基因型、环境及其互作对黄淮麦区小麦淀粉品质性状的影响[J]. 麦类作物学报, 2001,21(2):14-19. |
| [29] |
Kuchel H, Hangridge P, Mosionnek L, et al. The genetic control of milling yield, dough rheology and barking quality of wheat[J]. Theoretical and Applied Genetics, 2006,112(8):1487.
doi: 10.1007/s00122-006-0252-z URL pmid: 16550398 |
| [30] | 刘慧, 王朝辉, 李富翠, 等. 不同麦区小麦籽粒蛋白质与氨基酸含量及评价[J]. 作物学报, 2016,42(5):768-777. |
| [1] | 高伟, 张俊, 郝西, 刘娟, 臧秀旺. 河南省花生生产区域变化分析[J]. 中国农学通报, 2023, 39(1): 22-30. |
| [2] | 周冬冬, 张军, 葛梦婕, 刘忠红, 朱晓欢, 李春燕. 不同氮肥处理对稻茬晚播小麦‘淮麦36’产量、氮素利用率和品质的影响[J]. 中国农学通报, 2023, 39(1): 1-7. |
| [3] | 武迪, 张锋, 隋春莹, 师君慧, 万雪洁, 刘义国, 韩伟, 师长海. 外源活性物质对小麦苗期抗逆性的影响[J]. 中国农学通报, 2022, 38(9): 14-19. |
| [4] | 王福玉, 陈贵菊, 孙雷明, 黄玲, 邵敏敏, 赵凯, 杨本洲, 张玉丹, 闫璐, 王霖. 耕作方式与施氮量互作对小麦生长、产量与品质的影响[J]. 中国农学通报, 2022, 38(9): 20-26. |
| [5] | 秦乃群, 马巧云, 高敬伟, 杨璞, 蔡金兰, 郝迎春, 李艳梅, 冀洪策, 廖祥政. 沼渣施用对花生小麦轮作作物产量及土壤养分和重金属含量的影响[J]. 中国农学通报, 2022, 38(8): 58-63. |
| [6] | 武志斌, 黄超, 雷媛, 敬峰, 刘战东. 不同产量水平下冬小麦水肥利用特性研究[J]. 中国农学通报, 2022, 38(8): 64-71. |
| [7] | 姜佳, 陈金鹏, 魏江桥, 郭旭昊, 车志平, 田月娥, 陈根强, 刘圣明. 咯菌腈与戊唑醇复配对小麦赤霉病菌的增效作用研究[J]. 中国农学通报, 2022, 38(6): 116-120. |
| [8] | 姚金保, 杨学明, 周淼平, 张鹏. 江苏省小麦参试品种(系)产量与产量构成因素分析[J]. 中国农学通报, 2022, 38(6): 15-19. |
| [9] | 梁增基, 慕芳, 王楠. 渭北高原小麦育种的演变与展望[J]. 中国农学通报, 2022, 38(6): 8-14. |
| [10] | 汪小飞, 张家伟, 刘铁宁, 任小龙, 贾志宽, 蔡铁. 小麦抗倒伏研究动态追踪——基于WoS和CNKI数据库的文献计量分析[J]. 中国农学通报, 2022, 38(5): 132-142. |
| [11] | 王雪娇, 李梁, 毛昭庆, 李隆伟, 陈良正. 云南构建区域粮食产业链及供应链对策研究[J]. 中国农学通报, 2022, 38(5): 157-164. |
| [12] | 李红梅, 权文婷, 张树誉. 气候变暖对陕西中北部冬小麦返青前热量资源的影响[J]. 中国农学通报, 2022, 38(4): 53-61. |
| [13] | 尹逊栋, 吕广德, 牟秋焕, 米勇, 殷复伟, 李宁, 钱兆国, 吴科. 播种量对‘鑫麦296’产量和干物质生产及转运的影响[J]. 中国农学通报, 2022, 38(34): 1-7. |
| [14] | 范婷, 赵凯敏, 刘明敏, 杨迪迪, 丁锦峰, 朱敏, 李春燕, 朱新开, 郭文善. 苏中地区稻茬小麦生产措施采用特征与效益调研分析[J]. 中国农学通报, 2022, 38(32): 155-164. |
| [15] | 马悦梅, 王荣党. 基于比较优势理论的云南省主要粮食作物优势指数化测度[J]. 中国农学通报, 2022, 38(30): 141-150. |
| 阅读次数 | ||||||
|
全文 |
|
|||||
|
摘要 |
|
|||||