欢迎访问《中国农学通报》,

中国农学通报 ›› 2026, Vol. 42 ›› Issue (13): 196-207.doi: 10.11924/j.issn.1000-6850.casb2025-0587
郑尧1,2( ), 刘婷燕2, 徐钢春1,2
收稿日期:2025-07-10
修回日期:2026-01-06
出版日期:2026-07-15
发布日期:2026-07-09
作者简介:郑尧,男,1986年出生,安徽安庆人,副研究员,博士,主要从事健康养殖研究。通信地址:214081 江苏省无锡市滨湖区薛家里69号,Tel:0510-85390026,E-mail:zhengy@ffrc.cn。
基金资助:
ZHENG Yao1,2(), LIU Tingyan2, XU Gangchun1,2
Received:2025-07-10
Revised:2026-01-06
Published:2026-07-15
Online:2026-07-09
摘要:
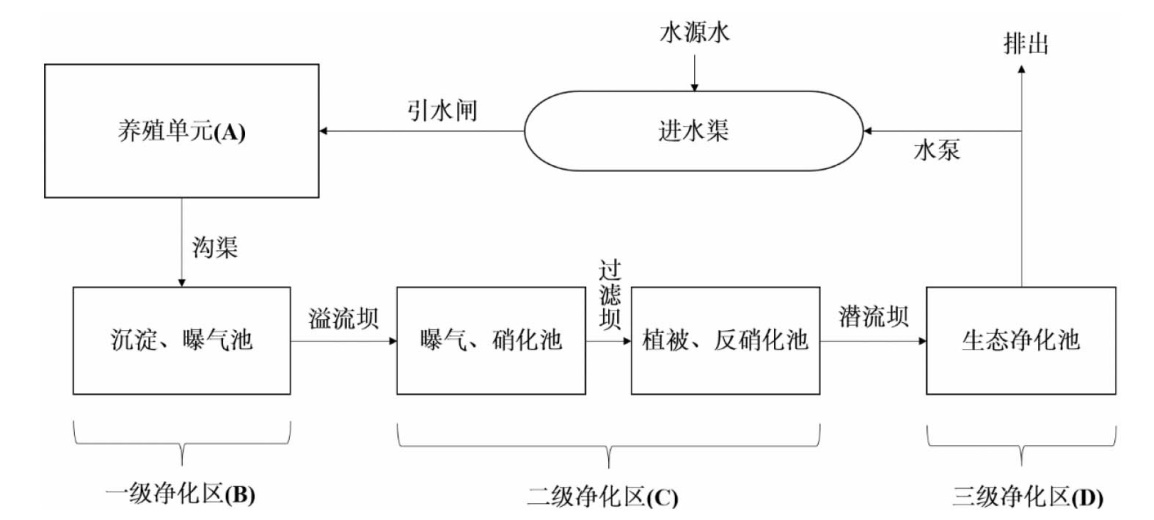
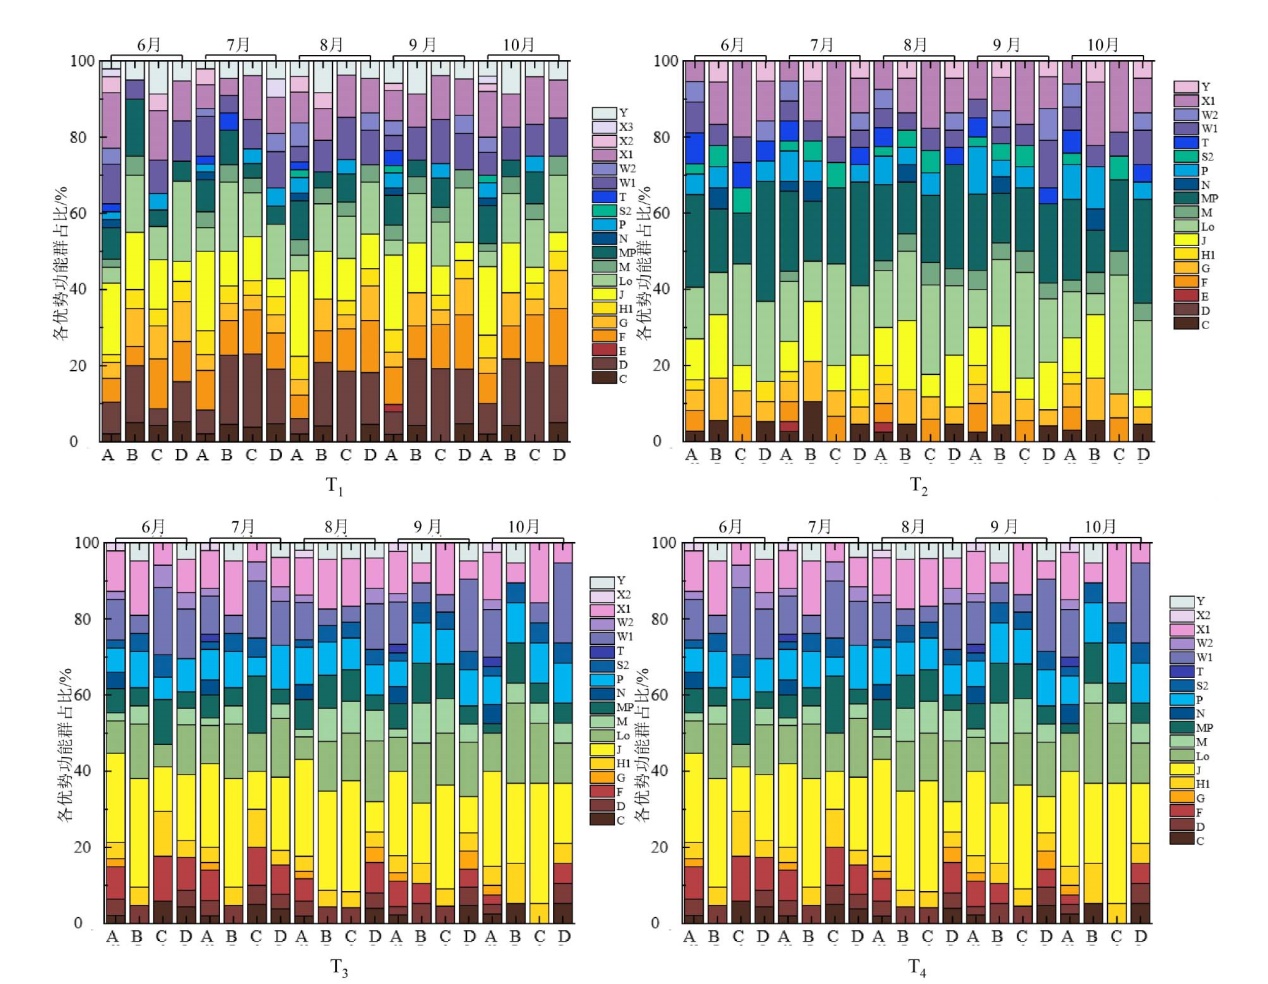
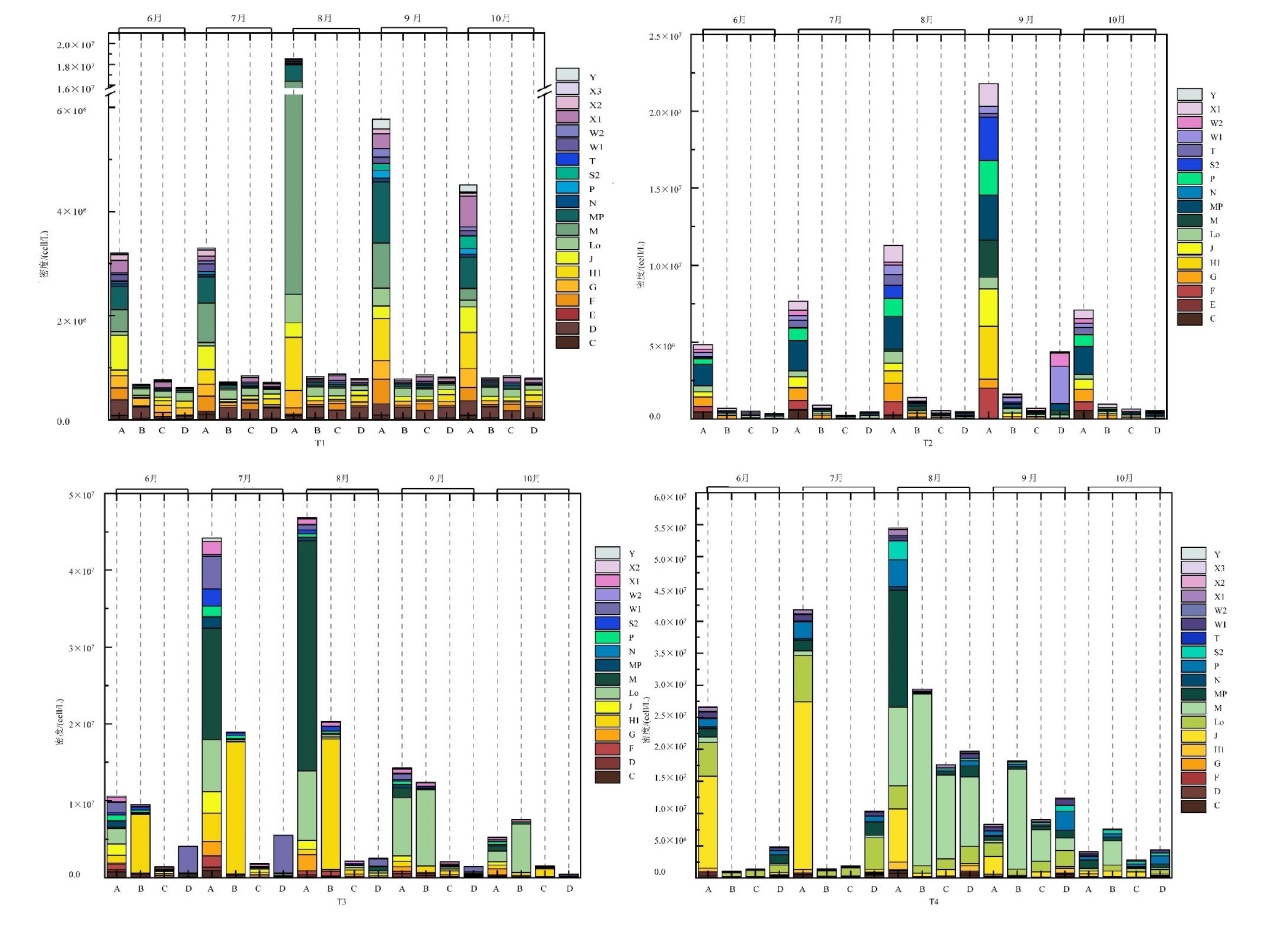
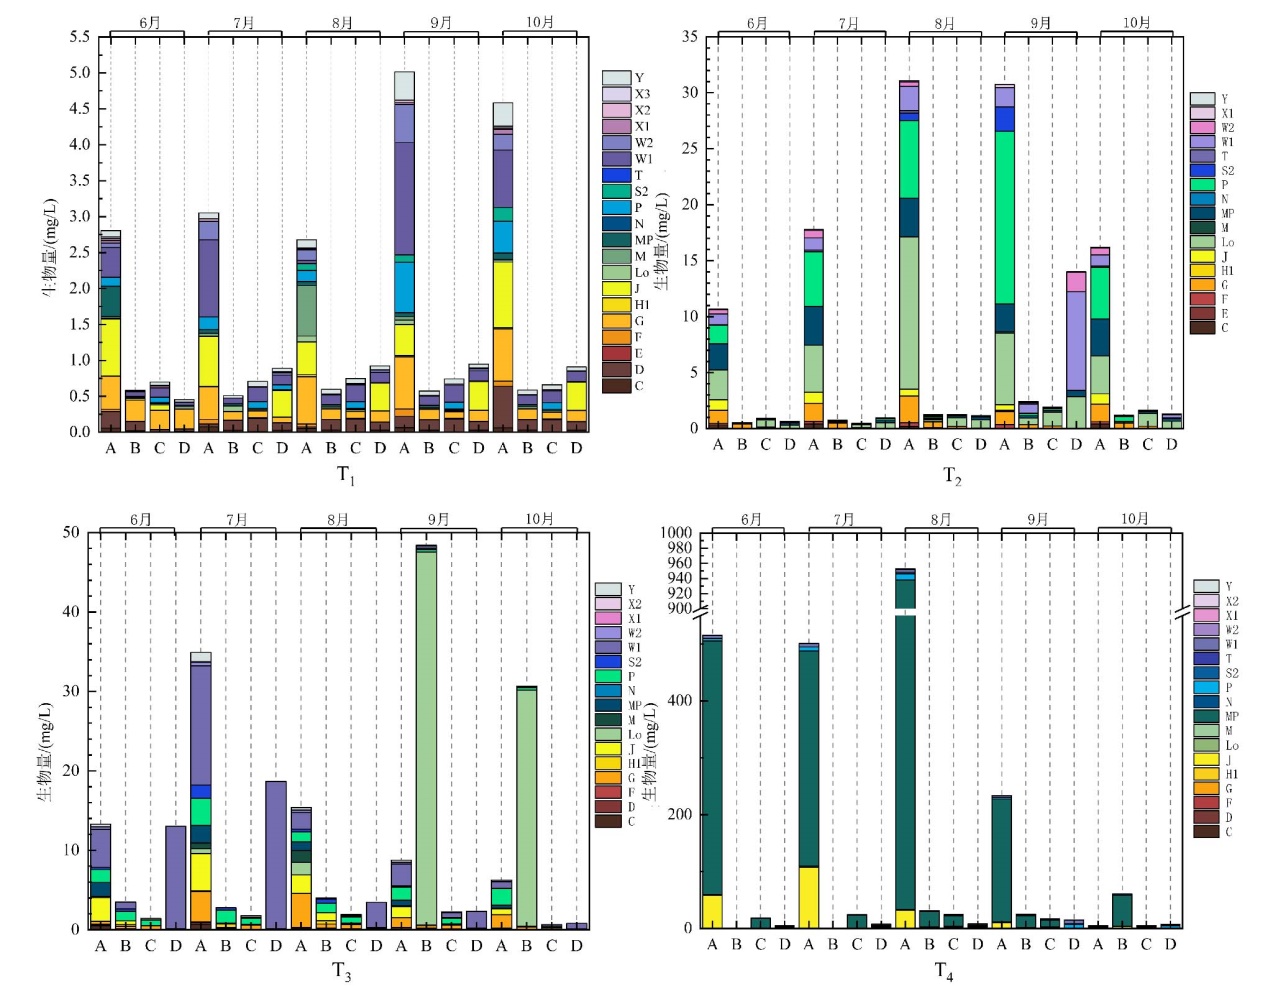
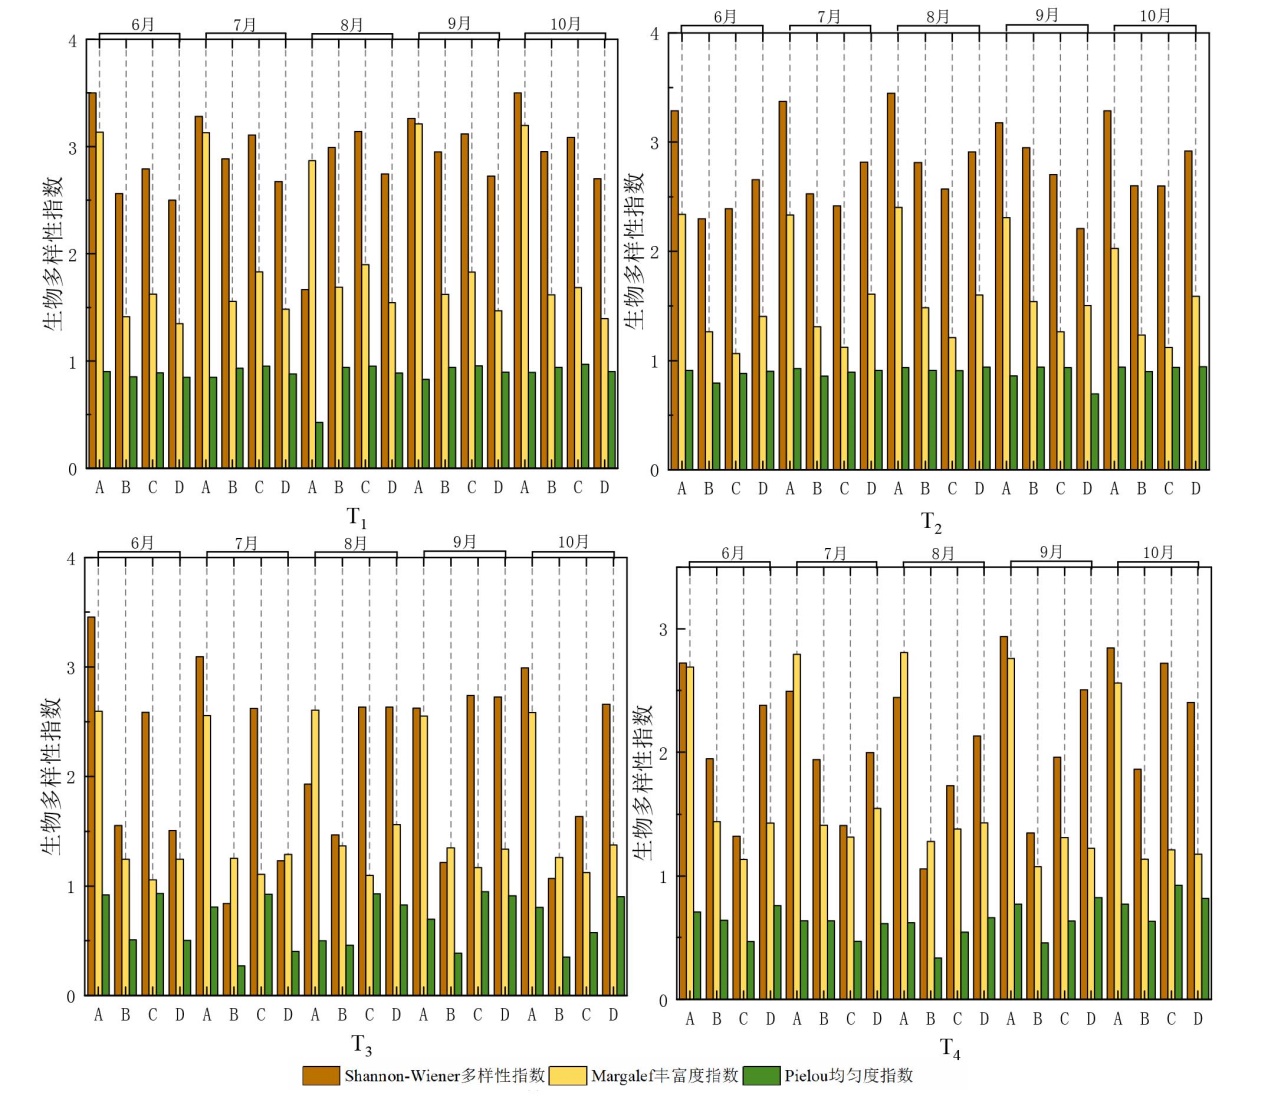
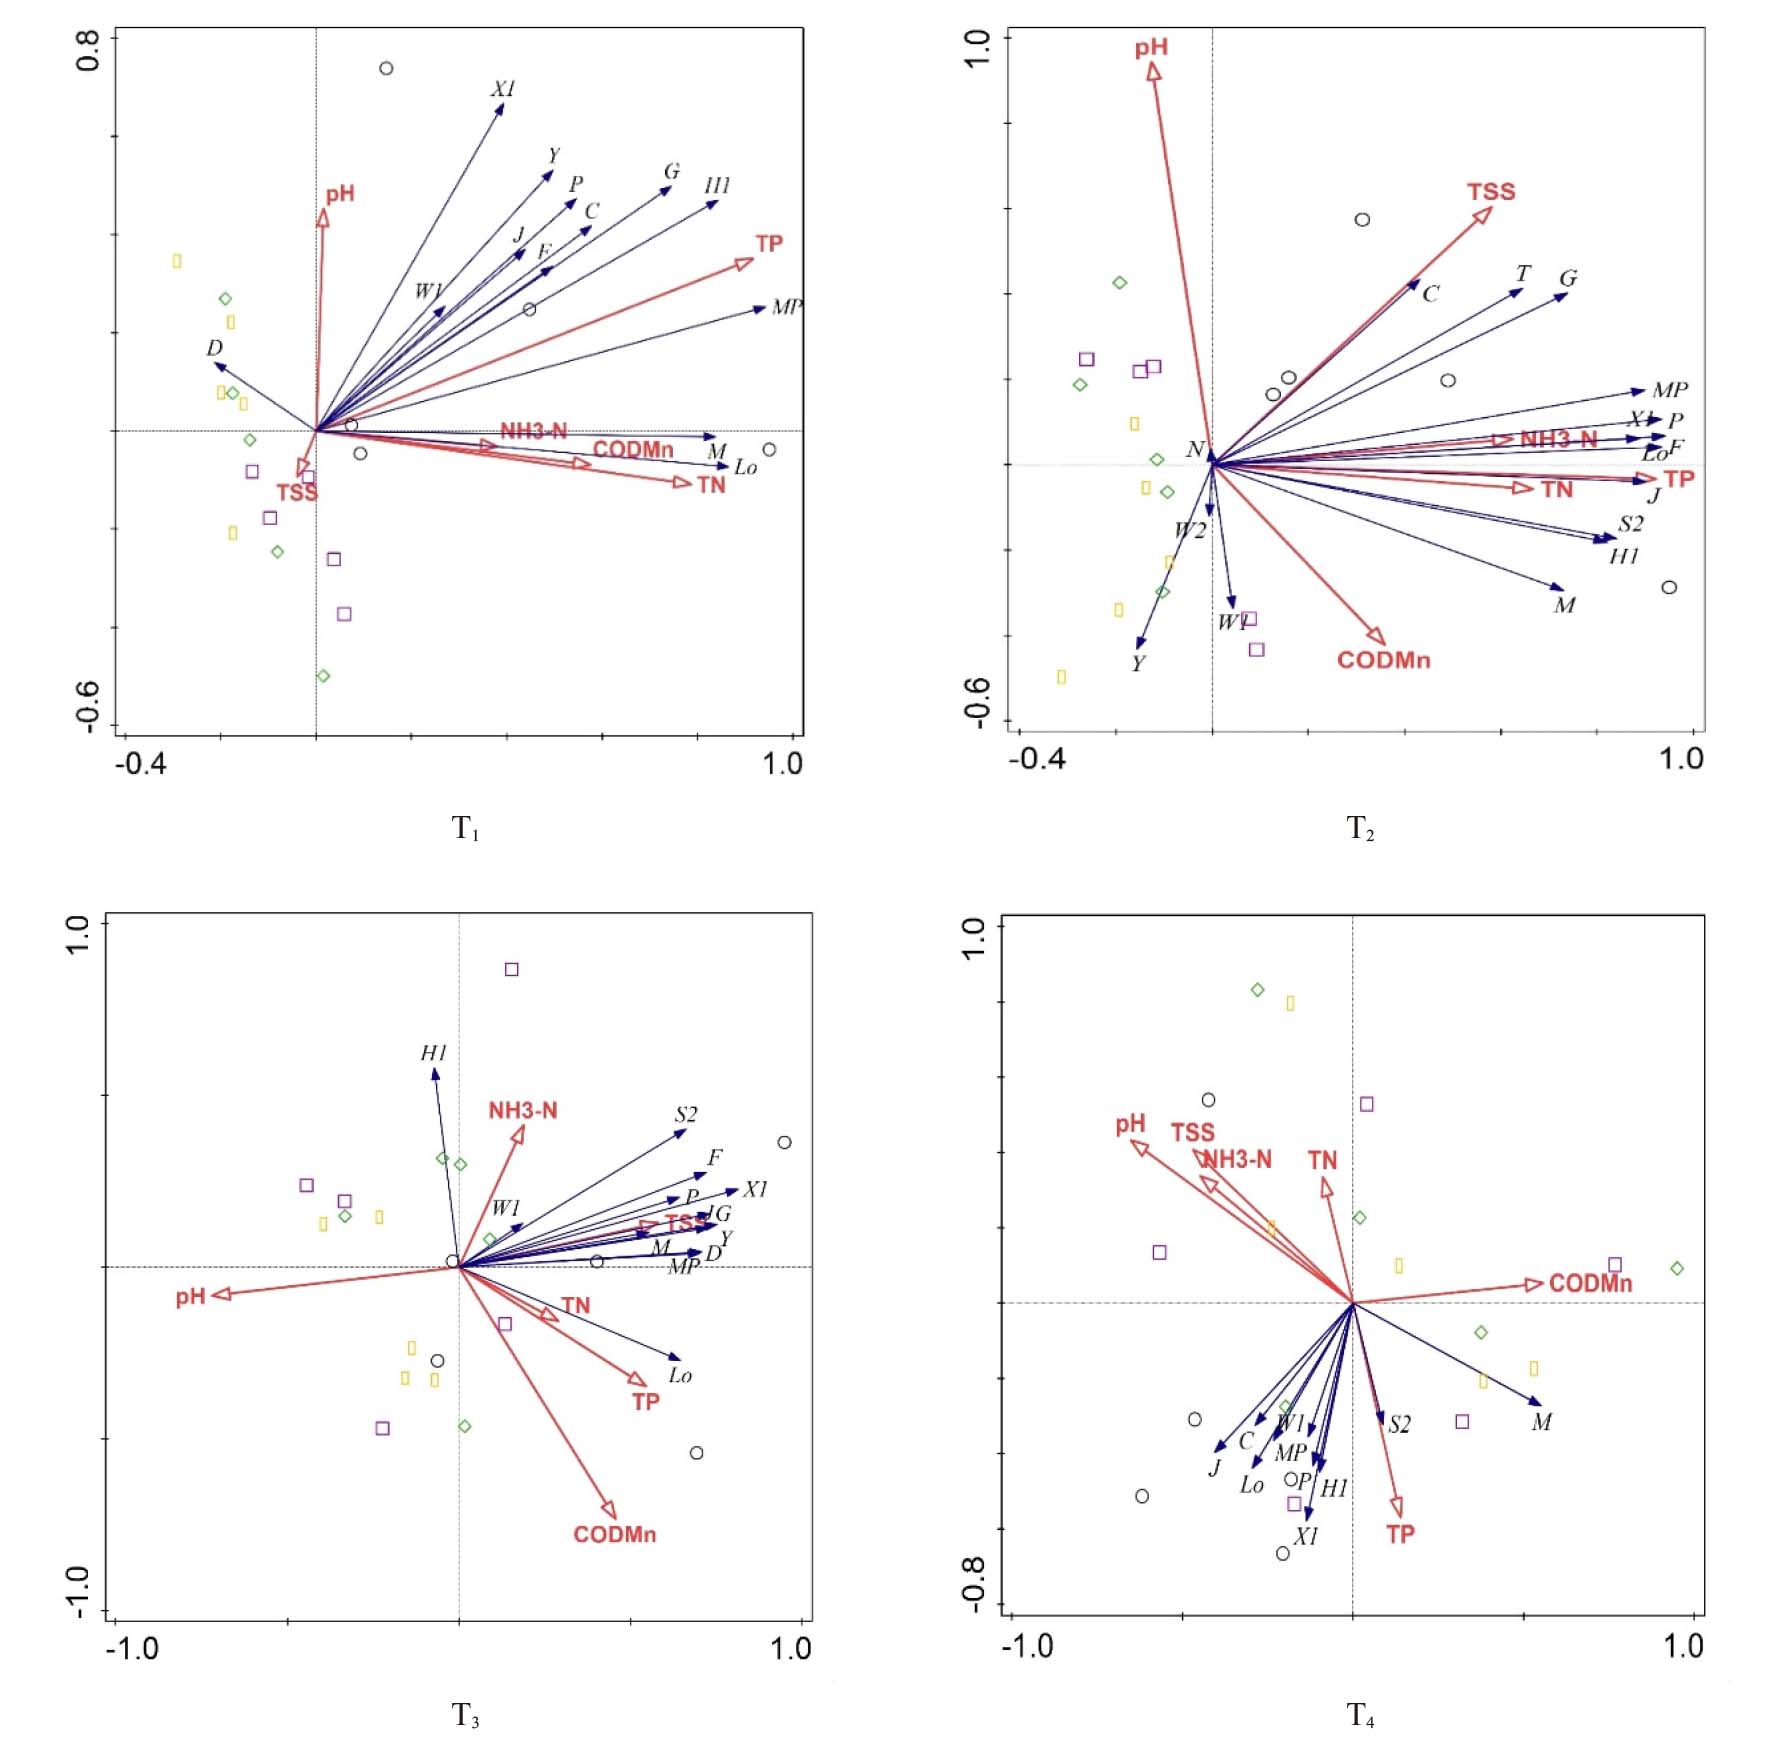
基于三级净化技术对苏州池塘进行标准化改造,为探究其系统内各净化区浮游植物群落结构,2022年6—10月期间对扣/成蟹塘(T1)、南美白对虾塘(T2)、鲈鱼塘(T3)及草鲫混养塘(T4)各净化区水样的浮游植物群落进行分析,并通过浮游植物优势功能群评价水体营养状态。结果表明,T1~T4实验区内浮游植物物种数分别为85、65、59、66,浮游植物功能群数量为20、17、17、18。浮游植物功能群密度和生物量均表现为T4>T3>T2>T1,最大值出现在9—10月;Shannon-Wiener多样性指数依次为T1>T2>T3>T4;Margalef丰富度指数依次为T1>T4>T2>T3;Pielou均匀度指数浮游依次为T2>T1>T3>T4。植物优势功能群以代表富营养/超富营养水体的M+MP功能群为主演替为以广适应性的Lo功能群和富营养水体的J功能群;与浮游植物优势功能群相关的环境因子为TN和TP。基于浮游植物优势功能群可以评价水环境状态并能及时准确分析出水质变化情况。
中图分类号:
郑尧, 刘婷燕, 徐钢春. 苏州经改造后池塘及三级净化区浮游植物群落结构[J]. 中国农学通报, 2026, 42(13): 196-207.
ZHENG Yao, LIU Tingyan, XU Gangchun. Phytoplankton Community Structure of Continuous Three-level Purification Zones and Ponds After Standardized Transformation in Suzhou City[J]. Chinese Agricultural Science Bulletin, 2026, 42(13): 196-207.
| 标号 | 采样点位置 | 养殖面积/ hm2 | 养殖品种 | 养殖密度/ (尾/hm2) | 净化区主要放养生物 |
|---|---|---|---|---|---|
| T1 | 苏州市吴中区临湖现代渔业示范园 (31°07′53.73″N、120°29′31.05″E) | 1.33 | 中华绒螯蟹(扣蟹) (Eriocheir sinensis) | 15000 | 芦苇、伊乐藻、苦草、菹草、莲、鲢、鳙 |
| T2 | 苏州市吴中区澄湖农庄 (31°14′11.89″N、20°48′2.39″E) | 21.33 | 凡纳滨对虾 (Litopenaeus vannamei) | 1275000 | 伊乐藻、睡莲、莲藕、芦苇、花白鲢、 少量鲫鱼、草鱼、螺蛳、河蚌 |
| T3 | 苏州市相城区荡田滩 (31°31′21.05″N、120°49′2.61″E) | 4.47 | 大口黑鲈 (Micropterus salmoides) | 30000 | 美人蕉、芦苇、伊乐藻、鲢、鳙 |
| T4 | 苏州市吴江区西庙路 (30°58′20.53″N、120°32′13.65″E) | 3.67 | 草鱼(Ctenopharyngodon idellus)、 鲫(Carassius auratus) | 3000 | 苦草、金钱草、水花生、芦苇、鲢、鳙 |
| 标号 | 采样点位置 | 养殖面积/ hm2 | 养殖品种 | 养殖密度/ (尾/hm2) | 净化区主要放养生物 |
|---|---|---|---|---|---|
| T1 | 苏州市吴中区临湖现代渔业示范园 (31°07′53.73″N、120°29′31.05″E) | 1.33 | 中华绒螯蟹(扣蟹) (Eriocheir sinensis) | 15000 | 芦苇、伊乐藻、苦草、菹草、莲、鲢、鳙 |
| T2 | 苏州市吴中区澄湖农庄 (31°14′11.89″N、20°48′2.39″E) | 21.33 | 凡纳滨对虾 (Litopenaeus vannamei) | 1275000 | 伊乐藻、睡莲、莲藕、芦苇、花白鲢、 少量鲫鱼、草鱼、螺蛳、河蚌 |
| T3 | 苏州市相城区荡田滩 (31°31′21.05″N、120°49′2.61″E) | 4.47 | 大口黑鲈 (Micropterus salmoides) | 30000 | 美人蕉、芦苇、伊乐藻、鲢、鳙 |
| T4 | 苏州市吴江区西庙路 (30°58′20.53″N、120°32′13.65″E) | 3.67 | 草鱼(Ctenopharyngodon idellus)、 鲫(Carassius auratus) | 3000 | 苦草、金钱草、水花生、芦苇、鲢、鳙 |
| 功能群 | 环境特征 | 耐受 | 敏感 | 代表属/种 |
|---|---|---|---|---|
| Codon C | 富营养、中小型水体 | 低光照、低含碳量 | 硅消耗、水体分层 | Aulacoseira ambigua |
| Cyclotella | ||||
| Asterionella | ||||
| Codon D | 含有营养盐、浑浊 | 冲刷 | 营养缺乏 | Synedra |
| Nitzschia | ||||
| Codon E | 贫营养或异养型、小型水体、浅水 | 低营养(有赖于混合营养) | 二氧化碳缺乏 | Dinobryon |
| Mallomonas | ||||
| Epipyxis | ||||
| Codon F | 中到富营养、洁净、混合强 | 低营养、高浑浊 | 二氧化碳缺乏 | Botryococcus |
| Oocystis | ||||
| Kirchneriella | ||||
| Codon G | 富营养、停滞水体 | 高光照 | 营养盐缺乏 | Volvox |
| Eudorina | ||||
| Pandorina | ||||
| Codon H1 | 富营养、分层、含氮低、浅水 | 低含氮量、低含碳量 | 水体混合、低光照、低含磷量 | Anabaena |
| Anabaenopsis | ||||
| Aphanizomenon | ||||
| Codon J | 高营养、混合、浅水 | — | 高光照 | Pediastrum |
| Coelastrum | ||||
| Crucigenia | ||||
| Codon K | 富营养的浅水 | — | 水体高度混合 | Aphanocapsa |
| Aphanothece | ||||
| Chlorella | ||||
| Codon Lo | 贫到富营养、中到大型水体、可深可浅 | 营养分层 | 长时间或深层的混合 | Peridinium |
| Gymnodinium | ||||
| Merismopedia | ||||
| Woronichinia | ||||
| Codon M | 小到中型、富营养到超富营养、稳定、透明度较高 | 暴晒 | 冲刷作用、低光照 | Microcystis |
| Codon MP | 经常性搅动、浑浊、浅水 | 混合搅动 | — | Pseudanabaena |
| Cylindrospermopsis | ||||
| Achnanthes | ||||
| Codon N | 持续或半持续的混合水层 | 低营养 | 水体分层、pH 升高 | Cosmarium |
| Staurastrum | ||||
| Codon P | 持续或半持续的混合水层 | 中程度的低光照和低碳含量 | 水体分层、硅元素缺乏 | Aulacoseira |
| Granulate | ||||
| Closterium | ||||
| Codon S2 | 温暖、高碱性、浅水 | 低光照 | 冲刷作用 | Spirulina |
| Arthrospira platensis | ||||
| Codon T | 持续混合水层 | 低光照 | 营养缺乏 | Mougeotia |
| Mesotaenium | ||||
| Codon W1 | 有机污染、浅水 | 高生化需氧量 | 牧食作用 | Euglena |
| Phacus | ||||
| Gonium | ||||
| Codon W2 | 中营养、浅水 | — | — | Trachelomonas |
| Strombomonas | ||||
| Codon X1 | 超富营养、浅水 | 分层 | 营养缺乏、滤食作用 | Monoraphidium |
| Chlorella | ||||
| Ochromonas | ||||
| Codon X2 | 中到富营养、浅水 | 分层 | 水体混合,滤食作用 | Chrysocromulina |
| Ochromonas | ||||
| Chroomonas | ||||
| Codon X3 | 贫营养、混合、浅水 | 恶劣环境条件 | 水体混合、牧食作用 | Chlorella |
| Ochromonas | ||||
| Schroederia | ||||
| Codon Y | 静水环境 | 低光照 | 吞噬作用 | Glenodinium |
| Gymnodinium | ||||
| Cryptomonas |
| 功能群 | 环境特征 | 耐受 | 敏感 | 代表属/种 |
|---|---|---|---|---|
| Codon C | 富营养、中小型水体 | 低光照、低含碳量 | 硅消耗、水体分层 | Aulacoseira ambigua |
| Cyclotella | ||||
| Asterionella | ||||
| Codon D | 含有营养盐、浑浊 | 冲刷 | 营养缺乏 | Synedra |
| Nitzschia | ||||
| Codon E | 贫营养或异养型、小型水体、浅水 | 低营养(有赖于混合营养) | 二氧化碳缺乏 | Dinobryon |
| Mallomonas | ||||
| Epipyxis | ||||
| Codon F | 中到富营养、洁净、混合强 | 低营养、高浑浊 | 二氧化碳缺乏 | Botryococcus |
| Oocystis | ||||
| Kirchneriella | ||||
| Codon G | 富营养、停滞水体 | 高光照 | 营养盐缺乏 | Volvox |
| Eudorina | ||||
| Pandorina | ||||
| Codon H1 | 富营养、分层、含氮低、浅水 | 低含氮量、低含碳量 | 水体混合、低光照、低含磷量 | Anabaena |
| Anabaenopsis | ||||
| Aphanizomenon | ||||
| Codon J | 高营养、混合、浅水 | — | 高光照 | Pediastrum |
| Coelastrum | ||||
| Crucigenia | ||||
| Codon K | 富营养的浅水 | — | 水体高度混合 | Aphanocapsa |
| Aphanothece | ||||
| Chlorella | ||||
| Codon Lo | 贫到富营养、中到大型水体、可深可浅 | 营养分层 | 长时间或深层的混合 | Peridinium |
| Gymnodinium | ||||
| Merismopedia | ||||
| Woronichinia | ||||
| Codon M | 小到中型、富营养到超富营养、稳定、透明度较高 | 暴晒 | 冲刷作用、低光照 | Microcystis |
| Codon MP | 经常性搅动、浑浊、浅水 | 混合搅动 | — | Pseudanabaena |
| Cylindrospermopsis | ||||
| Achnanthes | ||||
| Codon N | 持续或半持续的混合水层 | 低营养 | 水体分层、pH 升高 | Cosmarium |
| Staurastrum | ||||
| Codon P | 持续或半持续的混合水层 | 中程度的低光照和低碳含量 | 水体分层、硅元素缺乏 | Aulacoseira |
| Granulate | ||||
| Closterium | ||||
| Codon S2 | 温暖、高碱性、浅水 | 低光照 | 冲刷作用 | Spirulina |
| Arthrospira platensis | ||||
| Codon T | 持续混合水层 | 低光照 | 营养缺乏 | Mougeotia |
| Mesotaenium | ||||
| Codon W1 | 有机污染、浅水 | 高生化需氧量 | 牧食作用 | Euglena |
| Phacus | ||||
| Gonium | ||||
| Codon W2 | 中营养、浅水 | — | — | Trachelomonas |
| Strombomonas | ||||
| Codon X1 | 超富营养、浅水 | 分层 | 营养缺乏、滤食作用 | Monoraphidium |
| Chlorella | ||||
| Ochromonas | ||||
| Codon X2 | 中到富营养、浅水 | 分层 | 水体混合,滤食作用 | Chrysocromulina |
| Ochromonas | ||||
| Chroomonas | ||||
| Codon X3 | 贫营养、混合、浅水 | 恶劣环境条件 | 水体混合、牧食作用 | Chlorella |
| Ochromonas | ||||
| Schroederia | ||||
| Codon Y | 静水环境 | 低光照 | 吞噬作用 | Glenodinium |
| Gymnodinium | ||||
| Cryptomonas |
| 样本 | 优势功能群 | A | B | C | D | 样本 | 优势功能群 | A | B | C | D |
|---|---|---|---|---|---|---|---|---|---|---|---|
| T1 | C | — | 0.05 | — | 0.05 | T2 | C | 0.04 | 0.05 | — | 0.03 |
| D | 0.02 | 0.27 | 0.18 | 0.23 | F | 0.08 | — | 0.03 | — | ||
| F | 0.04 | 0.04 | 0.14 | 0.03 | G | 0.08 | 0.19 | 0.15 | — | ||
| G | 0.04 | 0.11 | 0.07 | 0.11 | H1 | 0.08 | — | — | — | ||
| H1 | 0.08 | — | 0.05 | 0.17 | J | 0.09 | 0.10 | — | — | ||
| J | 0.06 | 0.10 | 0.08 | 0.10 | Lo | 0.05 | 0.14 | 0.24 | 0.12 | ||
| Lo | 0.03 | 0.21 | 0.17 | 0.14 | M | 0.04 | 0.04 | 0.05 | 0.04 | ||
| M | 0.46 | 0.04 | — | — | MP | 0.19 | 0.11 | 0.13 | 0.15 | ||
| MP | 0.12 | 0.07 | 0.05 | — | N | — | 0.02 | — | — | ||
| P | — | — | 0.04 | — | P | 0.10 | 0.04 | — | — | ||
| W1 | — | 0.04 | 0.04 | 0.03 | S2 | 0.07 | 0.02 | 0.04 | — | ||
| X1 | 0.04 | — | 0.11 | 0.07 | T | 0.04 | — | — | — | ||
| Y | — | 0.03 | 0.04 | 0.03 | W1 | 0.04 | 0.06 | 0.04 | 0.32 | ||
| W2 | — | — | — | 0.15 | |||||||
| X1 | 0.08 | 0.17 | 0.22 | 0.03 | |||||||
| Y | — | 0.02 | — | — | |||||||
| 种类数 | 9 | 10 | 10 | 10 | 种类数 | 13 | 12 | 8 | 7 | ||
| T3 | D | — | — | 0.07 | — | T4 | C | — | — | — | 0.03 |
| F | 0.03 | — | — | — | H1 | 0.02 | — | — | 0.04 | ||
| G | 0.05 | — | 0.12 | — | J | 0.38 | 0.03 | 0.08 | 0.03 | ||
| H1 | 0.05 | 0.63 | 0.29 | 0.04 | Lo | 0.14 | 0.08 | 0.19 | 0.23 | ||
| J | 0.05 | — | 0.15 | 0.06 | M | 0.08 | 0.79 | 0.33 | 0.26 | ||
| Lo | 0.22 | 0.25 | 0.11 | 0.06 | MP | 0.17 | 0.02 | 0.04 | 0.13 | ||
| M | 0.38 | — | — | — | P | 0.07 | 0.02 | 0.03 | 0.12 | ||
| MP | 0.03 | — | — | — | S2 | 0.02 | — | 0.03 | — | ||
| P | 0.03 | 0.02 | 0.04 | — | W1 | 0.03 | — | — | 0.06 | ||
| S2 | 0.03 | 0.02 | 0.06 | 0.02 | X1 | — | — | 0.03 | — | ||
| W1 | 0.06 | — | — | 0.71 | |||||||
| X1 | 0.03 | 0.02 | 0.11 | — | |||||||
| Y | — | — | 0.03 | — | |||||||
| 种类数 | 11 | 5 | 9 | 5 | 种类数 | 8 | 5 | 7 | 8 |
| 样本 | 优势功能群 | A | B | C | D | 样本 | 优势功能群 | A | B | C | D |
|---|---|---|---|---|---|---|---|---|---|---|---|
| T1 | C | — | 0.05 | — | 0.05 | T2 | C | 0.04 | 0.05 | — | 0.03 |
| D | 0.02 | 0.27 | 0.18 | 0.23 | F | 0.08 | — | 0.03 | — | ||
| F | 0.04 | 0.04 | 0.14 | 0.03 | G | 0.08 | 0.19 | 0.15 | — | ||
| G | 0.04 | 0.11 | 0.07 | 0.11 | H1 | 0.08 | — | — | — | ||
| H1 | 0.08 | — | 0.05 | 0.17 | J | 0.09 | 0.10 | — | — | ||
| J | 0.06 | 0.10 | 0.08 | 0.10 | Lo | 0.05 | 0.14 | 0.24 | 0.12 | ||
| Lo | 0.03 | 0.21 | 0.17 | 0.14 | M | 0.04 | 0.04 | 0.05 | 0.04 | ||
| M | 0.46 | 0.04 | — | — | MP | 0.19 | 0.11 | 0.13 | 0.15 | ||
| MP | 0.12 | 0.07 | 0.05 | — | N | — | 0.02 | — | — | ||
| P | — | — | 0.04 | — | P | 0.10 | 0.04 | — | — | ||
| W1 | — | 0.04 | 0.04 | 0.03 | S2 | 0.07 | 0.02 | 0.04 | — | ||
| X1 | 0.04 | — | 0.11 | 0.07 | T | 0.04 | — | — | — | ||
| Y | — | 0.03 | 0.04 | 0.03 | W1 | 0.04 | 0.06 | 0.04 | 0.32 | ||
| W2 | — | — | — | 0.15 | |||||||
| X1 | 0.08 | 0.17 | 0.22 | 0.03 | |||||||
| Y | — | 0.02 | — | — | |||||||
| 种类数 | 9 | 10 | 10 | 10 | 种类数 | 13 | 12 | 8 | 7 | ||
| T3 | D | — | — | 0.07 | — | T4 | C | — | — | — | 0.03 |
| F | 0.03 | — | — | — | H1 | 0.02 | — | — | 0.04 | ||
| G | 0.05 | — | 0.12 | — | J | 0.38 | 0.03 | 0.08 | 0.03 | ||
| H1 | 0.05 | 0.63 | 0.29 | 0.04 | Lo | 0.14 | 0.08 | 0.19 | 0.23 | ||
| J | 0.05 | — | 0.15 | 0.06 | M | 0.08 | 0.79 | 0.33 | 0.26 | ||
| Lo | 0.22 | 0.25 | 0.11 | 0.06 | MP | 0.17 | 0.02 | 0.04 | 0.13 | ||
| M | 0.38 | — | — | — | P | 0.07 | 0.02 | 0.03 | 0.12 | ||
| MP | 0.03 | — | — | — | S2 | 0.02 | — | 0.03 | — | ||
| P | 0.03 | 0.02 | 0.04 | — | W1 | 0.03 | — | — | 0.06 | ||
| S2 | 0.03 | 0.02 | 0.06 | 0.02 | X1 | — | — | 0.03 | — | ||
| W1 | 0.06 | — | — | 0.71 | |||||||
| X1 | 0.03 | 0.02 | 0.11 | — | |||||||
| Y | — | — | 0.03 | — | |||||||
| 种类数 | 11 | 5 | 9 | 5 | 种类数 | 8 | 5 | 7 | 8 |
| 处理 | 参数 | 第1轴 | 第2轴 | 第3轴 | 第4轴 | 处理 | 参数 | 第1轴 | 第2轴 | 第3轴 | 第4轴 |
|---|---|---|---|---|---|---|---|---|---|---|---|
| T1 | 特征值 | 0.7014 | 0.0051 | 0.0016 | 0.0001 | T2 | 特征值 | 0.6754 | 0.041 | 0.0233 | 0.0063 |
| 累积解释量 | 70.14 | 70.64 | 70.8 | 70.81 | 累积解释量 | 67.54 | 71.65 | 73.97 | 74.6 | ||
| 伪典范系数 | 0.8477 | 0.5294 | 0.8477 | 0.434 | 伪典范系数 | 0.9357 | 0.6259 | 0.4776 | 0.6665 | ||
| 累积拟合解释量 | 99.05 | 99.76 | 99.98 | 100 | 累积拟合解释量 | 90.38 | 95.87 | 98.99 | 99.83 | ||
| T3 | 特征值 | 0.2312 | 0.1121 | 0.0106 | 0.0012 | T4 | 特征值 | 0.2028 | 0.1162 | 0.0174 | 0.002 |
| 累积解释量 | 23.12 | 34.33 | 35.4 | 35.51 | 累积解释量 | 20.28 | 31.9 | 33.64 | 33.84 | ||
| 伪典范系数 | 0.6281 | 0.6431 | 0.5297 | 0.1971 | 伪典范系数 | 0.6582 | 0.5431 | 0.3825 | 0.3958 | ||
| 累积拟合解释量 | 64.99 | 96.49 | 99.48 | 99.82 | 累积拟合解释量 | 59.91 | 94.24 | 99.4 | 99.98 |
| 处理 | 参数 | 第1轴 | 第2轴 | 第3轴 | 第4轴 | 处理 | 参数 | 第1轴 | 第2轴 | 第3轴 | 第4轴 |
|---|---|---|---|---|---|---|---|---|---|---|---|
| T1 | 特征值 | 0.7014 | 0.0051 | 0.0016 | 0.0001 | T2 | 特征值 | 0.6754 | 0.041 | 0.0233 | 0.0063 |
| 累积解释量 | 70.14 | 70.64 | 70.8 | 70.81 | 累积解释量 | 67.54 | 71.65 | 73.97 | 74.6 | ||
| 伪典范系数 | 0.8477 | 0.5294 | 0.8477 | 0.434 | 伪典范系数 | 0.9357 | 0.6259 | 0.4776 | 0.6665 | ||
| 累积拟合解释量 | 99.05 | 99.76 | 99.98 | 100 | 累积拟合解释量 | 90.38 | 95.87 | 98.99 | 99.83 | ||
| T3 | 特征值 | 0.2312 | 0.1121 | 0.0106 | 0.0012 | T4 | 特征值 | 0.2028 | 0.1162 | 0.0174 | 0.002 |
| 累积解释量 | 23.12 | 34.33 | 35.4 | 35.51 | 累积解释量 | 20.28 | 31.9 | 33.64 | 33.84 | ||
| 伪典范系数 | 0.6281 | 0.6431 | 0.5297 | 0.1971 | 伪典范系数 | 0.6582 | 0.5431 | 0.3825 | 0.3958 | ||
| 累积拟合解释量 | 64.99 | 96.49 | 99.48 | 99.82 | 累积拟合解释量 | 59.91 | 94.24 | 99.4 | 99.98 |
| [1] |
农业农村部渔业渔政管理局. 中国渔业年鉴[M]. 北京: 中国农业出版社, 2025.
|
| [2] |
王钰钦, 郑尧, 钱信宇, 等. 中国水产养殖尾水污染现状及净化技术研究进展[J]. 农学学报, 2022, 12(3):65-70.
doi: 10.11923/j.issn.2095-4050.cjas20200300088 |
| [3] |
魏宾, 方洁, 顾雪林, 等. 基于“三池两坝”组合流程的池塘养殖尾水净化效能[J]. 水产养殖, 2021, 42(11):27-34.
|
| [4] |
王钰钦, 郑尧, 钱信宇, 等. 初沉单元中净化材料的筛选及运行参数研究[J]. 农业环境科学学报, 2020, 39(11):2621-2630
|
| [5] |
doi: 10.1002/rra.v37.8 URL |
| [6] |
doi: 10.1093/plankt/24.5.417 URL |
| [7] |
刘婷燕, 王晓飞, 尹统统, 等. 不同养殖池塘经标准化改造后尾水净化效果及水质评价[J]. 中国农学通报, 2023, 39(26):154-164.
doi: 10.11924/j.issn.1000-6850.casb2022-0803 |
| [8] |
国家环境保护总局. 水和废水检测分析方法[M]. 北京: 中国环境科学出版社, 2002.
|
| [9] |
中国水产科学研究院淡水渔业研究中心, 中国水产科学研究院长江水产研究所. SC/T 9101—2007,淡水池塘养殖水排放要求[S]. 北京, 2007.
|
| [10] |
江苏省人民政府. DB32/ 4043—2021,池塘养殖尾水排放标准[S]. 南京, 2021.
|
| [11] |
江苏省人民政府. DB32/T 3238—2017,淡水池塘循环水健康养殖三级净化技术操作规[S]. 南京, 2017.
|
| [12] |
江苏省人民政府. DB32/T 4725—2024,池塘养殖尾水生态处理技术规范[S]. 南京, 2024.
|
| [13] |
章宗涉, 黄祥飞. 淡水浮游生物研究方法[M]. 北京: 科学出版社, 1991.
|
| [14] |
赵文. 水生生物学[M]. 北京: 中国农业出版社, 2009.
|
| [15] |
韩茂森, 束蕴芳. 中国淡水生物图谱[M]. 北京: 中国海洋出版社, 1995.
|
| [16] |
水利部水文局, 长江流域水环境监测中心. 中国内陆水域常见藻类图谱[M]. 武汉: 长江出版社, 2012.
|
| [17] |
葛优, 周彦锋, 王晨赫, 等. 阳澄西湖浮游藻类功能群演替特征及其与环境因子的关系[J]. 中国环境科学, 2019, 39(7):3027-3039.
|
| [18] |
马婕, 申利亚, 何培民, 等. 苏州城区河道浮游植物功能群演替特征及其对环境因子的响应[J]. 上海海洋大学学报, 2021, 30(1):103-112.
|
| [19] |
陶敏, 岳兴建, 罗家林, 等. 四川丘陵区水库浮游植物功能群季节演替特征及驱动因子[J]. 水生生物学报, 2021, 45(4):826-837.
|
| [20] |
刘婷燕, 王晓飞, 唐海军, 等. 标准化池塘改造后尾水处理区后生浮游动物群落结构[J]. 西南农业学报, 2025, 38(10):2264-2276.
|
| [21] |
彭亮, 陶玲, 陈思媛, 等. 循环水养殖池塘浮游植物功能群结构特征[J]. 水生态学杂志, 2026, 47(2):161-170.
|
| [22] |
胡庚东, 宋超, 陈家长, 等. 池塘循环水养殖模式的构建及其对氮磷的去除效果[J]. 生态与农村环境学报, 2011, 27(3):82-86.
|
| [23] |
蔡敏, 周丽, 张旭, 等. 植物提取液对养殖水体浮游植物群落结构和功能的影响[J]. 生态环境学报, 2025, 34(7):1090.
doi: 10.16258/j.cnki.1674-5906.2025.07.009 |
| [24] |
郑尧, 杨晓曦, 钱信宇, 等. 中草药净水与抗菌效果研究[J]. 环境科学与技术, 2020, 43(1):222-228.
|
| [25] |
郑尧, 邴旭文, 裘丽萍, 等. 浮床栽培鱼腥草对吉富罗非鱼胆汁液中八种免疫因子的影响[J]. 农业环境科学学报, 2016, 35(9):1680-1685.
|
| [26] |
张瑞. 青苔对成蟹蜕壳期养殖池塘浮游生物的影响及其抑制研究[D]. 南京: 南京师范大学, 2022.
|
| [27] |
李天丽, 高广斌, 白东, 等. 洪湖周边三种典型养殖类型池塘浮游植物群落特征及其与环境因子的关系[J]. 淡水渔业, 2024, 54(4):3-14.
|
| [28] |
孙世萍, 咸玉兰, 韩军军, 等. 内陆地区南美白对虾淡化养殖池塘浮游植物群落结构特征及其生态影响因子[J]. 水产学杂志, 2024, 37(1):96-103.
|
| [29] |
赵志楠, 王俊健, 张元娜, 等. 南水北调中线水源区浮游植物群落结构及其生物多样性[J]. 南水北调与水利科技(中英文), 2022, 20(5):914-924.
|
| [30] |
王政委, 于飞, 杨程, 等. 连云港地区养殖池塘水质监测与评价[J]. 中国农学通报, 2025, 41(28):155-164.
doi: 10.11924/j.issn.1000-6850.casb2025-0031 |
| [1] | 王晨龙, 闵杰, 梁睿, 谭熊宇, 王烁, 吾木提·艾山江. 水稻根际土壤微生物细菌群落组成及多样性分析[J]. 中国农学通报, 2025, 41(4): 84-93. |
| [2] | 董晓庆, 陈铭, 唐治博, 牛小天, 陈秀梅, 王桂芹. 复合微生物菌剂在池塘养殖水质调控上的应用及研究进展[J]. 中国农学通报, 2025, 41(15): 148-153. |
| [3] | 胡佳, 陈鑫. 高温天气因素对杏鲍菇不同生长阶段的影响[J]. 中国农学通报, 2024, 40(36): 57-62. |
| [4] | 钟立强, 周丽颖, 张世勇, 刘洪岩, 陈校辉, 王明华. 养殖池塘水体异味物质土臭素与环境因子关系解析[J]. 中国农学通报, 2024, 40(27): 159-164. |
| [5] | 郑仕夫, 徐慧敏, 陈曦, 裘丽萍, 宋超, 范立民, 李丹丹, 孟顺龙, 徐跑. 水产养殖尾水处理技术的研究现状和发展趋势[J]. 中国农学通报, 2024, 40(12): 159-164. |
| [6] | 金渝钦, 陈曦, 孟顺龙, 李菲, 裘丽萍, 李丹丹, 王伟萍, 徐慧敏, 宋超, 范立民, 胡庚东, 徐跑. 典型池塘养殖模式的氮磷收支研究进展[J]. 中国农学通报, 2023, 39(36): 140-147. |
| [7] | 陈爱平. 极小种群闽桦生殖物候及种子萌发影响因素研究[J]. 中国农学通报, 2023, 39(32): 47-55. |
| [8] | 柯瑞林, 任黎华, 孟顺龙. 水产养殖尾水处理技术研究进展[J]. 中国农学通报, 2023, 39(29): 146-151. |
| [9] | 刘婷燕, 王晓飞, 安树伟, 顾玲玲, 许晶, 郑尧, 徐钢春. 不同池塘经标准化改造后尾水净化效果及水质评价[J]. 中国农学通报, 2023, 39(26): 154-164. |
| [10] | 曹红妹, 胡桂萍, 黄振侠, 石旭平, 蔡翔, 王丰, 刘宇新, 王亚威, 王礼献. 秸秆异地覆盖对作物病虫草害及土壤环境因子的影响[J]. 中国农学通报, 2023, 39(20): 100-108. |
| [11] | 孙慧, 吴中能, 苗婷婷, 刘俊龙, 苏晓华, 丁昌俊, 曹志华, 闫彩霞, 王涛. 不同施肥处理对杨树林地土壤微生物群落的影响[J]. 中国农学通报, 2023, 39(2): 36-43. |
| [12] | 王硕, 郑秀文, 刘冠, 张萌萌. 环境因子及内源物质对果树中花青素调控的研究进展[J]. 中国农学通报, 2023, 39(19): 51-57. |
| [13] | 王岩, 王丽伟, 赵洪颜, 赵敏, 杨洪岩. 不同人参栽培土壤养分及微生物群落组成特征解析[J]. 中国农学通报, 2022, 38(5): 60-68. |
| [14] | 刘雨婷, 黄世玉, 李榴佳, 赵天章, 李慧英, 苏子峰, 龙晓文. 池塘与稻田养殖鲤鱼生物学指数和肌肉营养价值的比较[J]. 中国农学通报, 2022, 38(4): 159-164. |
| [15] | 王恕桥, 但言, 李燕, 沈子伟, 余凤琴. 嘉陵江合川段浮游生物及其与环境因子的关系[J]. 中国农学通报, 2022, 38(36): 74-79. |
| 阅读次数 | ||||||
|
全文 |
|
|||||
|
摘要 |
|
|||||
