欢迎访问《中国农学通报》,
中国农学通报 ›› 2023, Vol. 39 ›› Issue (26): 86-97.doi: 10.11924/j.issn.1000-6850.casb2022-0809
刘佳宁( ), 孙丽娜()
收稿日期:2022-09-18
修回日期:2022-11-21
出版日期:2023-09-15
发布日期:2023-09-11
通讯作者:
孙丽娜,女,1983年出生,黑龙江巴彦人,副教授,博士,主要从事土地流转、土地规划、土地生态效应方面的研究。通信地址:150080 黑龙江省哈尔滨市南岗区学府路74号,E-mail:nana19831118@163.com。
作者简介:刘佳宁,女,1998年出生,黑龙江鹤岗人,硕士研究生,主要从事土地生态效应研究。通信地址:150080 黑龙江省哈尔滨市南岗区学府路74号,E-mail:1754790959@qq.com。
基金资助:
LIU Jianing(), SUN Lina()
Received:2022-09-18
Revised:2022-11-21
Published-:2023-09-15
Online:2023-09-11
摘要:
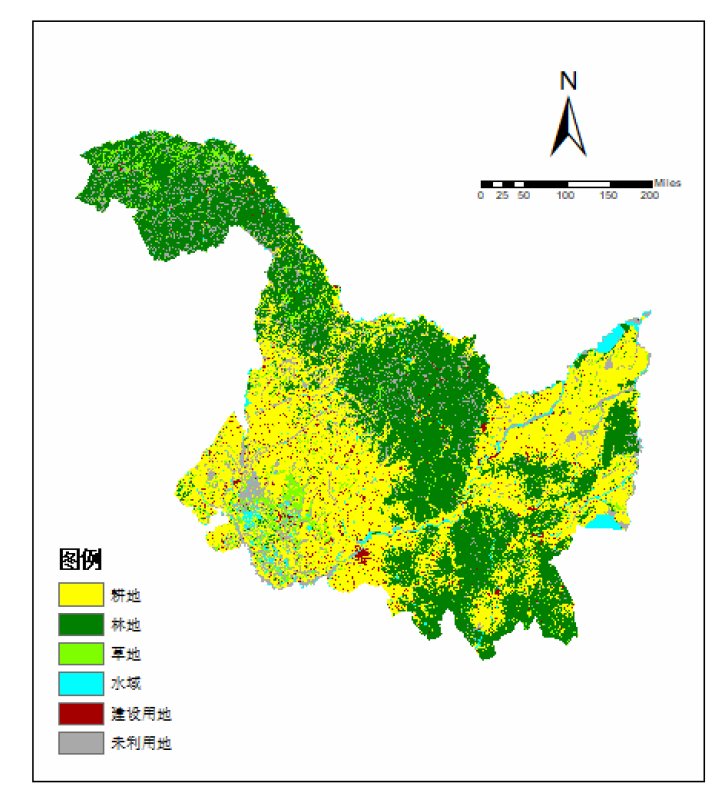
土地利用碳排放时空分异格局研究对于指导区域实现碳中和目标具有重要意义。本文以1980—2020年黑龙江省遥感影像和能源消耗数据为基础,采用土地利用碳排放计算和碳排放风险指数测算模型,结合土地利用转移矩阵、ArcGIS空间分析等方法,对黑龙江省土地利用现状、碳排放时空格局以及碳排放风险进行分析。结果表明:黑龙江省主要用地类型为耕地和建设用地且面积逐年增加,建设用地是最主要的碳源,林地、草地和水域面积逐年下降,林地是最主要的碳汇。1980—2020年黑龙江省土地利用碳排放量呈现不同程度的上升,在碳源方面,总碳源量呈现出波动上升的变化趋势;在碳汇方面,总碳汇量逐年降低。2000—2020年各市域碳排放总量呈现不同程度的增加,其中2000—2010年增速较快,2010—2020年增速较缓,2000—2020年各市域碳排放空间差异性逐渐显著,风险等级逐年升高。依据相关分析结果,本文期望为黑龙江省低碳土地利用模式和碳减排政策提供参考,为中国“双碳”目标的实现提供决策支持。
刘佳宁, 孙丽娜. 1980—2020年黑龙江省土地利用碳排放时空分异研究[J]. 中国农学通报, 2023, 39(26): 86-97.
LIU Jianing, SUN Lina. Study on Spatial and Temporal Variation of Carbon Emission of Land Use in Heilongjiang Province from 1980 to 2020[J]. Chinese Agricultural Science Bulletin, 2023, 39(26): 86-97.

| 能源种类 | 折标准煤系数 | 碳排放系数 |
|---|---|---|
| 煤炭 | 0.7143 | 0.7559 |
| 焦炭 | 0.9714 | 0.8550 |
| 原油 | 1.4286 | 0.5857 |
| 汽油 | 1.4714 | 0.5538 |
| 煤油 | 1.4714 | 0.5714 |
| 柴油 | 1.4571 | 0.5921 |
| 燃料油 | 1.4286 | 0.6185 |
| 天然气 | 1.3300* | 0.4483 |
| 电力 | 0.1229** | 2.2132 |
| 能源种类 | 折标准煤系数 | 碳排放系数 |
|---|---|---|
| 煤炭 | 0.7143 | 0.7559 |
| 焦炭 | 0.9714 | 0.8550 |
| 原油 | 1.4286 | 0.5857 |
| 汽油 | 1.4714 | 0.5538 |
| 煤油 | 1.4714 | 0.5714 |
| 柴油 | 1.4571 | 0.5921 |
| 燃料油 | 1.4286 | 0.6185 |
| 天然气 | 1.3300* | 0.4483 |
| 电力 | 0.1229** | 2.2132 |


| 年份 | 耕地 | 林地 | 草地 | 水域 | 建设用地 | 未利用地 |
|---|---|---|---|---|---|---|
| 1980 | 1333.97 | 2173.17 | 403.73 | 150.06 | 80.14 | 375.85 |
| 1990 | 1422.27 | 2155.71 | 376.63 | 152.62 | 84.74 | 324.94 |
| 1995 | 1542.30 | 2114.62 | 326.49 | 145.76 | 85.22 | 302.52 |
| 2000 | 1603.42 | 2072.69 | 317.85 | 146.60 | 85.97 | 290.38 |
| 2005 | 1614.00 | 2069.45 | 319.66 | 144.51 | 86.60 | 282.70 |
| 2010 | 1619.29 | 2065.62 | 321.07 | 145.73 | 86.97 | 278.24 |
| 2015 | 1639.82 | 2057.16 | 317.38 | 144.60 | 89.91 | 268.05 |
| 2020 | 1732.97 | 1917.61 | 220.97 | 115.88 | 109.01 | 429.20 |
| 40年变化量 | 399.00 | -255.56 | -182.76 | -34.18 | 28.87 | 53.35 |
| 土地利用 类型 | 1980—1990 | 1990—2000 | 2000—2010 | 2010—2020 | 1980—2020 | ||||||||||||||||||
|---|---|---|---|---|---|---|---|---|---|---|---|---|---|---|---|---|---|---|---|---|---|---|---|
| 变化幅度/ (×104 hm2) | 动态度 | 变化幅度/ (×104 hm2) | 动态度 | 变化幅度/ (×104 hm2) | 动态度 | 变化幅度/ (×104 hm2) | 动态度 | 变化幅度/ (×104 hm2) | 动态度 | ||||||||||||||
| 耕地 | 88.30 | 0.66 | 181.15 | 1.27 | 15.87 | 0.10 | 113.68 | 0.70 | 399.00 | 0.75 | |||||||||||||
| 林地 | -17.46 | -0.08 | -83.02 | -0.39 | -7.07 | -0.03 | -148.01 | -0.72 | -255.56 | -0.29 | |||||||||||||
| 草地 | -27.10 | -0.67 | -58.78 | -1.56 | 3.22 | 0.10 | -100.10 | -3.12 | -182.76 | -1.13 | |||||||||||||
| 水域 | 2.56 | 0.17 | -6.02 | -0.39 | -0.87 | -0.06 | -29.85 | -2.05 | -34.18 | -0.57 | |||||||||||||
| 建设用地 | 4.60 | 0.57 | 1.23 | 0.15 | 1.00 | 0.12 | 22.04 | 2.53 | 28.87 | 0.90 | |||||||||||||
| 未利用地 | -50.91 | -1.35 | -34.56 | -1.06 | -12.14 | -0.42 | 150.96 | 5.43 | 53.35 | 0.35 | |||||||||||||
| 1980年 | 2020年 | |||||||||||||||
|---|---|---|---|---|---|---|---|---|---|---|---|---|---|---|---|---|
| 耕地 | 林地 | 草地 | 水域 | 建设用地 | 未利用地 | |||||||||||
| 耕地 | 1093.07 | 82.51 | 31.92 | 16.23 | 68.37 | 41.39 | ||||||||||
| 林地 | 224.77 | 1672.16 | 94.69 | 15.39 | 9.25 | 155.14 | ||||||||||
| 草地 | 134.40 | 113.86 | 63.88 | 7.09 | 6.13 | 78.02 | ||||||||||
| 水域 | 37.04 | 7.04 | 5.84 | 56.18 | 2.40 | 40.13 | ||||||||||
| 建设用地 | 52.24 | 4.00 | 1.99 | 1.23 | 18.13 | 2.53 | ||||||||||
| 未利用地 | 189.91 | 34.95 | 22.34 | 13.86 | 4.53 | 110.05 | ||||||||||
| 1980年 | 1990年 | |||||||||||||||
| 耕地 | 林地 | 草地 | 水域 | 建设用地 | 未利用地 | |||||||||||
| 耕地 | 1326.29 | 0.58 | 1.35 | 0.45 | 2.44 | 2.86 | ||||||||||
| 林地 | 21.49 | 2147.40 | 2.39 | 0.35 | 0.76 | 0.78 | ||||||||||
| 草地 | 29.64 | 4.58 | 361.54 | 0.85 | 0.95 | 6.16 | ||||||||||
| 水域 | 0.42 | 0.05 | 0.08 | 149.12 | 0 | 0.39 | ||||||||||
| 建设用地 | 0 | 0 | 0 | 0 | 80.14 | 0 | ||||||||||
| 未利用地 | 44.43 | 3.10 | 11.27 | 1.85 | 0.45 | 314.75 | ||||||||||
| 1990年 | 2000年 | |||||||||||||||
| 耕地 | 林地 | 草地 | 水域 | 建设用地 | 未利用地 | |||||||||||
| 耕地 | 1406.97 | 4.91 | 3.02 | 1.80 | 1.59 | 3.98 | ||||||||||
| 林地 | 84.36 | 2057.51 | 12.52 | 0.16 | 0.19 | 0.97 | ||||||||||
| 草地 | 70.86 | 9.72 | 294.97 | 0.55 | 0.08 | 0.45 | ||||||||||
| 水域 | 3.67 | 0.34 | 3.14 | 142.14 | 0 | 3.33 | ||||||||||
| 建设用地 | 0.26 | 0 | 0.37 | 0.01 | 84.10 | 0 | ||||||||||
| 未利用地 | 37.30 | 0.21 | 3.83 | 1.94 | 0.01 | 281.65 | ||||||||||
| 2000年 | 2010年 | |||||||||||||||
| 耕地 | 林地 | 草地 | 水域 | 建设用地 | 未利用地 | |||||||||||
| 耕地 | 1588.64 | 5.82 | 5.28 | 1.11 | 1.67 | 0.90 | ||||||||||
| 林地 | 10.16 | 2054.74 | 6.11 | 0.25 | 0.16 | 1.27 | ||||||||||
| 草地 | 6.62 | 3.79 | 304.88 | 0.62 | 0.20 | 1.74 | ||||||||||
| 水域 | 1.41 | 0.08 | 0.51 | 143.01 | 0.02 | 1.57 | ||||||||||
| 建设用地 | 0.88 | 0.06 | 0.08 | 0.06 | 84.87 | 0.02 | ||||||||||
| 未利用地 | 11.58 | 1.12 | 4.21 | 0.68 | 0.05 | 272.74 | ||||||||||
| 2010年 | 2020年 | |||||||||||||||
| 耕地 | 林地 | 草地 | 水域 | 建设用地 | 未利用地 | |||||||||||
| 耕地 | 1302.79 | 125.03 | 44.58 | 18.24 | 69.61 | 58.40 | ||||||||||
| 林地 | 167.87 | 1638.18 | 87.51 | 14.82 | 7.96 | 14.757 | ||||||||||
| 草地 | 66.37 | 106.99 | 64.00 | 5.48 | 4.23 | 73.71 | ||||||||||
| 水域 | 34.25 | 7.57 | 4.89 | 57.85 | 2.23 | 37.48 | ||||||||||
| 建设用地 | 54.82 | 4.41 | 2.23 | 1.29 | 21.32 | 2.89 | ||||||||||
| 未利用地 | 105.34 | 32.36 | 17.42 | 12.29 | 3.46 | 107.20 | ||||||||||
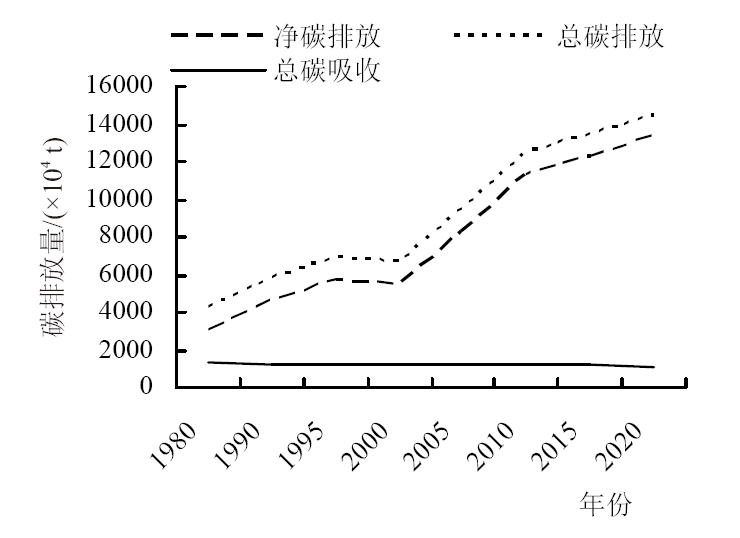
| 年份 | 碳源 | 碳汇 | 净碳排放 | |||||||
|---|---|---|---|---|---|---|---|---|---|---|
| 建设用地 | 耕地 | 总碳排放 | 林地 | 草地 | 水域 | 未利用地 | 总碳吸收 | |||
| 1980 | 3620.96 | 662.98 | 4283.97 | 1262.61 | 8.48 | 3.78 | 0.19 | 1275.06 | 3008.89 | |
| 1990 | 5149.28 | 706.87 | 5856.17 | 1252.47 | 7.91 | 3.85 | 0.16 | 1205.65 | 4591.76 | |
| 1995 | 6170.75 | 766.52 | 6937.32 | 1228.59 | 6.86 | 3.67 | 0.15 | 1212.85 | 5698.00 | |
| 2000 | 5893.52 | 796.90 | 6690.49 | 1204.23 | 6.67 | 3.69 | 0.15 | 1214.75 | 5475.67 | |
| 2005 | 8595.17 | 802.16 | 9397.41 | 1202.35 | 6.71 | 3.64 | 0.14 | 1212.85 | 8184.48 | |
| 2010 | 11709.86 | 804.79 | 12514.76 | 1200.13 | 6.74 | 3.67 | 0.14 | 1210.68 | 11303.97 | |
| 2015 | 12639.20 | 814.99 | 13454.28 | 1195.21 | 6.66 | 3.64 | 0.13 | 1205.65 | 12248.54 | |
| 2020 | 13535.04 | 861.29 | 14396.41 | 1114.13 | 4.64 | 2.92 | 0.21 | 1121.91 | 13274.42 | |
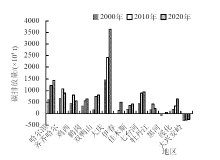
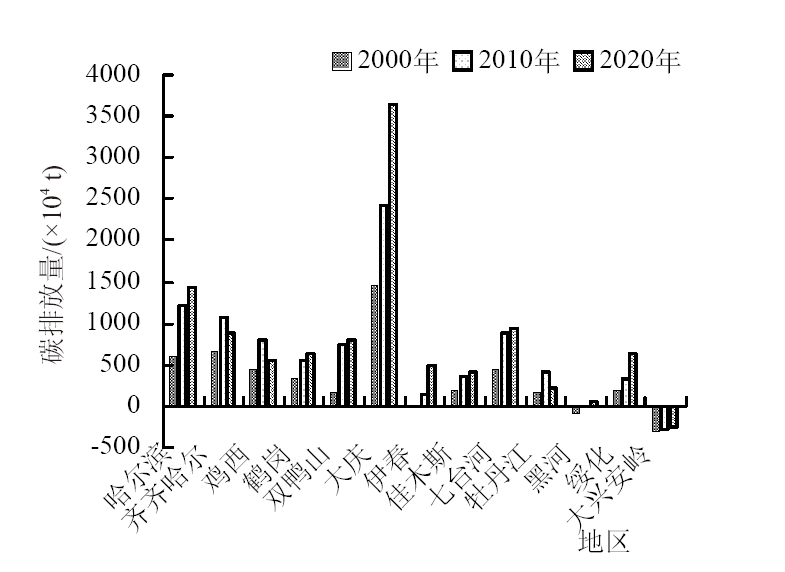
| 年份 | 哈尔滨 | 齐齐哈尔 | 鸡西 | 鹤岗 | 双鸭山 | 大庆 | 伊春 | 佳木斯 | 七台河 | 牡丹江 | 黑河 | 绥化 | 大兴安岭 |
|---|---|---|---|---|---|---|---|---|---|---|---|---|---|
| 2000 | 612.62 | 648.82 | 425.90 | 340.58 | 162.30 | 1449.85 | 4.76 | 195.70 | 441.48 | 151.82 | -80.54 | 199.63 | -294.59 |
| 2010 | 1224.58 | 1087.01 | 786.01 | 555.12 | 743.46 | 2414.27 | 146.43 | 351.75 | 867.99 | 399.81 | -5.09 | 323.26 | -290.15 |
| 2020 | 1421.37 | 885.96 | 541.93 | 635.95 | 786.03 | 3628.37 | 483.75 | 416.12 | 925.89 | 227.11 | 60.63 | 622.12 | -244.12 |

| 年份 | 哈尔滨 | 齐齐哈尔 | 鸡西 | 鹤岗 | 双鸭山 | 大庆 | 伊春 | 佳木斯 | 七台河 | 牡丹江 | 黑河 | 绥化 | 大兴安岭 |
|---|---|---|---|---|---|---|---|---|---|---|---|---|---|
| 2000 | 13.53 | 14.33 | 9.41 | 7.52 | 3.59 | 32.02 | 0.11 | 4.32 | 9.75 | 3.35 | -1.78 | 4.41 | -6.51 |
| 2010 | 27.05 | 24.01 | 17.36 | 12.26 | 16.42 | 53.32 | 3.23 | 7.77 | 19.17 | 8.83 | -0.11 | 7.14 | -6.41 |
| 2020 | 31.39 | 19.57 | 11.97 | 14.05 | 17.36 | 80.14 | 10.68 | 9.19 | 20.45 | 5.01 | 1.34 | 13.74 | -5.39 |

| [1] |
赵先超, 牛亚文, 肖杰, 等. 基于土地利用变化的岳阳市碳排放时空格局研究[J]. 湖南工业大学学报, 2022, 36(1):2,10-19.
|
| [2] |
王瑶. 国内外土地利用碳排放研究进展与挑战——基于CiteSpace知识图谱分析[J]. 上海房地, 2022(3):31-33.
|
| [3] |
赖力. 中国土地利用的碳排放效应研究[D]. 南京: 南京大学, 2010.
|
| [4] |
卢娜. 土地利用变化碳排放效应研究[D]. 南京: 南京农业大学, 2011.
|
| [5] |
张苗, 甘臣林, 陈银蓉. 基于SBM模型的土地集约利用碳排放效率分析与低碳优化[J]. 中国土地科学, 2016, 30(3):37-45.
|
| [6] |
游和远, 吴次芳. 土地利用的碳排放效率及其低碳优化——基于能源消耗的视角[J]. 自然资源学报, 2010, 25(11):1875-1886.
doi: 10.11849/zrzyxb.2010.11.007 |
| [7] |
胡国霞, 雷国平, 周浩, 等. 黑龙江省土地利用变化的碳排放效应研究[J]. 水土保持研究, 2015, 22(6):287-292.
|
| [8] |
路昌, 雷国平, 张慧, 等. 黑龙江省哈尔滨市不同土地利用类型的碳排放效应分析[J]. 水土保持研究, 2014, 21(6):245-250.
|
| [9] |
杜官印. 建设用地对碳排放的影响关系研究[J]. 中国土地科学, 2010, 24(5):32-36.
|
| [10] |
冯杰, 张胜, 王涛. 中国省际土地利用碳排放及其影响因素分析[J]. 统计与决策, 2019, 35(5):141-145.
|
| [11] |
陈珏, 袁洪英, 杨洋. 黑龙江省不同土地利用方式的碳排放效应及时空格局[J]. 中国农学通报, 2015, 31(35):158-163.
doi: 10.11924/j.issn.1000-6850.casb15050164 |
| [12] |
曲福田, 卢娜, 冯淑怡. 土地利用变化对碳排放的影响[J]. 中国人口·资源与环境, 2011, 21(10):76-83.
|
| [13] |
李小康, 王晓鸣, 华虹. 土地利用结构变化对碳排放的影响关系及机理研究[J]. 生态经济, 2018, 34(1):14-19.
|
| [14] |
杨文学, 张小平. 甘肃省土地利用碳排放变化及影响因素分解[J]. 安徽农业科学, 2016, 44(33):49-53.
|
| [15] |
张杰, 陈海, 刘迪, 等. 基于县域尺度土地利用碳排放的时空分异及影响因素研究[J]. 西北大学学报(自然科学版), 2022, 52(1):21-31.
|
| [16] |
檀斯园. 九江市土地利用碳排放风险时空分异及影响因素研究[D]. 南昌: 江西财经大学, 2022.
|
| [17] |
王冯薇, 赵荣钦, 谢志祥, 等. 碳中和目标下土地利用碳排放效率及其时空格局——以黄河流域72个地级市为例[J]. 中国土地科学, 2023, 37(1):102-113.
|
| [18] |
彭文甫, 樊淑云, 潘荟交, 等. 区域土地利用变化的碳排放效应及时空格局研究[J]. 生态经济, 2013(9):28-33.
|
| [19] |
周嘉, 王钰萱, 刘学荣, 等. 基于土地利用变化的中国省域碳排放时空差异及碳补偿研究[J]. 地理科学, 2019, 39(12):1955-1961.
doi: 10.13249/j.cnki.sgs.2019.12.014 |
| [20] |
孙赫, 梁红梅, 常学礼, 等. 中国土地利用碳排放及其空间关联[J]. 经济地理, 2015, 35(3):154-162.
|
| [21] |
张余, 姜博, 赵映慧, 等. 东北三省土地利用碳排放时空格局及影响因素研究[J]. 地域研究与开发, 2022, 41(4):150-156.
|
| [22] |
舒璜. 基于tapio模型的土地利用碳排放与经济发展的脱钩分析[D]. 南昌: 江西财经大学, 2020.
|
| [23] |
张中秋, 劳燕玲, 赵宁俊, 等. 广东省土地利用-碳减排-经济增长的脱钩关系[J]. 水土保持通报, 2022, 42(1):250-258,266.
|
| [24] |
邓宣凯. 武汉市土地利用碳排放特征及与经济增长的脱钩分析[J]. 武汉学研究, 2021(1):179-196.
|
| [25] |
李玉玲. 陕西省土地利用碳排放及其与经济增长的脱钩性研究[D]. 杨凌: 西北农林科技大学, 2018.
|
| [26] |
王丹, 荆延德, 韩善梅, 等. 基于格网的南四湖流域土地利用碳排放与其生态系统服务价值时空关系分析[J]. 生态学报, 2022, 42(23):9604-9614.
|
| [27] |
汤峰, 殷彦玲, 张蓬涛, 等. 基于土地利用变化的高阳县生态系统服务价值和碳排放风险研究[J]. 水土保持研究, 2019, 26(4):265-271.
|
| [28] |
杨皓然, 吴群. 碳排放视角下的江苏省土地利用转型生态效率研究——基于混合方向性距离函数[J]. 自然资源学报, 2017, 32(10):1718-1730.
doi: 10.11849/zrzyxb.20160906 |
| [29] |
王金艳, 王雅敬. 铜仁市土地利用变化的碳排放量及生态补偿研究[J]. 贵州科学, 2019, 37(3):42-47.
|
| [30] |
王雅敬, 谢炳庚, 李晓青, 等. 长株潭经济圈土地利用变化的碳排放量及生态补偿研究[J]. 生态科学, 2017, 36(4):160-165.
|
| [31] |
牛辉. 黑龙江省新型农民科技培训问题研究[D]. 长春: 吉林大学, 2016.
|
| [32] |
黑龙江省统计局,国家统计局黑龙江调查总队编. 黑龙江统计年鉴2021[S].
|
| [33] |
许思维. 东北地区土地利用碳排放特征及影响因素研究[D]. 沈阳: 沈阳师范大学, 2018.
|
| [34] |
李彦旻, 沈育生, 王世航. 基于土地利用变化的安徽省陆地碳排放时空特征及效应[J]. 水土保持学报, 2022, 36(1):182-188.
|
| [1] | 苑明睿, 杨峰山, 蔡柏岩, 付海燕, 刘春光. 农业土壤碳汇研究进展[J]. 中国农学通报, 2023, 39(8): 37-42. |
| [2] | 宋宏恩, 姜常宜, 李树超, 孙兆明. 山东省种植业碳排放度量分析[J]. 中国农学通报, 2023, 39(8): 43-50. |
| [3] | 王嘉浩, 肖洋, 张瑞豪, 王艳, 牛羽萱, 贺旭杨. 克东县2000—2020年植被覆盖变化分析[J]. 中国农学通报, 2023, 39(24): 77-83. |
| [4] | 管雅芳, 焦阳, 臧传富. 韩江流域土地利用时空变化特征及其生态安全评估[J]. 中国农学通报, 2023, 39(20): 91-99. |
| [5] | 刘兆旭, 刘晶, 郑国宏, 李建刚. 博尔塔拉蒙古自治州土地/植被覆盖变化及驱动力分析[J]. 中国农学通报, 2023, 39(16): 68-76. |
| [6] | 李梦琦, 张慧, 赵杰, 王立艳, 董昱辰, 肖辉. 天津市农田生态系统碳收支年际变化研究[J]. 中国农学通报, 2023, 39(14): 159-164. |
| [7] | 孙喜军, 邓睿, 吕爽, 高莹, 蔡苗, 缑巧红, 赵娟. 西安市农用地土壤有机质空间变异特征[J]. 中国农学通报, 2022, 38(35): 43-53. |
| [8] | 田雨桐, 韩志伟, 赵然, 田永著, 罗广飞, 杨淼. 西南岩溶农业区典型土地利用对土壤氮素特征的影响[J]. 中国农学通报, 2022, 38(33): 89-96. |
| [9] | 高琳, 胡晋豪, 汪志超, 林昌华, 冯慧敏. 粤北山区县域土地利用对生态服务价值的影响[J]. 中国农学通报, 2022, 38(32): 69-77. |
| [10] | 刘宝海, 李晓军, 高世伟, 吴立成, 肖明纲. 黑龙江省2025年粮食产能优化分析[J]. 中国农学通报, 2022, 38(28): 13-20. |
| [11] | 韩伟, 徐珊. 松嫩平原土地利用变化特征及生态系统服务价值研究——以哈尔滨市为例[J]. 中国农学通报, 2022, 38(26): 82-90. |
| [12] | 吴松, 刘永志, 杨立宾, 江云兵, 周甜. 森林温室气体排放的研究态势分析[J]. 中国农学通报, 2022, 38(19): 99-108. |
| [13] | 张佳琦, 郭宗珊, 刘长华, 李荣田. 黑龙江省水稻品种的遗传多样性[J]. 中国农学通报, 2022, 38(17): 1-9. |
| [14] | 马超. 黑龙江省黑土地保护性耕作实施基本情况及问题研究[J]. 中国农学通报, 2022, 38(17): 143-147. |
| [15] | 解林晓, 段艺芳, 肖超菲, 李金龙. 山东省土地利用生态-社会-经济系统耦合协调度时空演变及障碍因子分析[J]. 中国农学通报, 2022, 38(12): 61-68. |
| 阅读次数 | ||||||
|
全文 |
|
|||||
|
摘要 |
|
|||||