| [1] |
秦大河. 气候变化:区域应对与防灾减灾—气候变化背景下极端事件相关灾害影响及应对策略[M]. 北京: 科学出版社, 2009:16-17.
|
| [2] |
中国气象局气候变化中心. 中国气候变化蓝皮书(2019)[R]. 北京: 2019.
|
| [3] |
郭建平. 气候变化对中国农业生产的影响研究进展[J]. 应用气象学报, 2015, 26(01):1-11.
|
| [4] |
刘彦随, 刘玉, 郭丽英. 气候变化对中国农业生产的影响及应对策略[J]. 中国生态农业学报, 2010, 18(04):905-910.
|
| [5] |
祝景彬, 贺慧丹, 李红琴, 等. 青藏高原高寒湿地GPP变化特征及对生长季积温的响应[J]. 生态学报, 2020, 40(24):8958-8965.
|
| [6] |
祝景彬, 贺慧丹, 李红琴, 等. 祁连山南麓高寒灌丛GPP变化特征及对生长季积温的响应[J]. 草业科学, 2021, 38(2):221-230.
|
| [7] |
汤绪, 杨续超, 田展, 等. 气候变化对中国农业气候资源的影响[J]. 资源科学, 2011, 33(10):1962-1968.
|
| [8] |
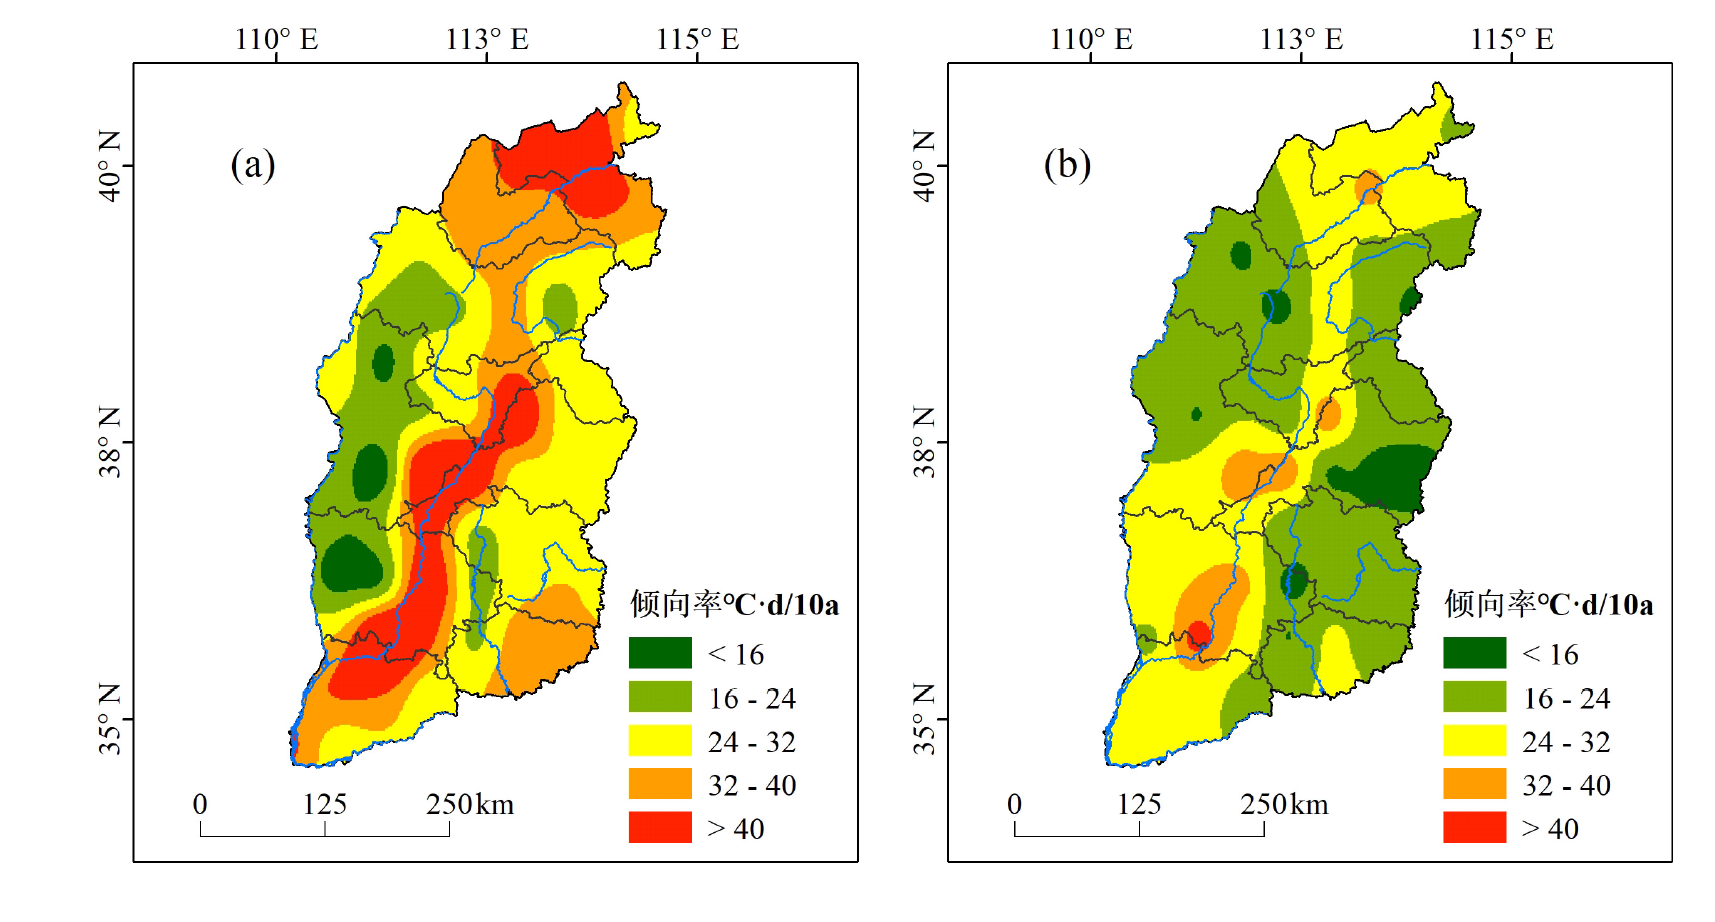
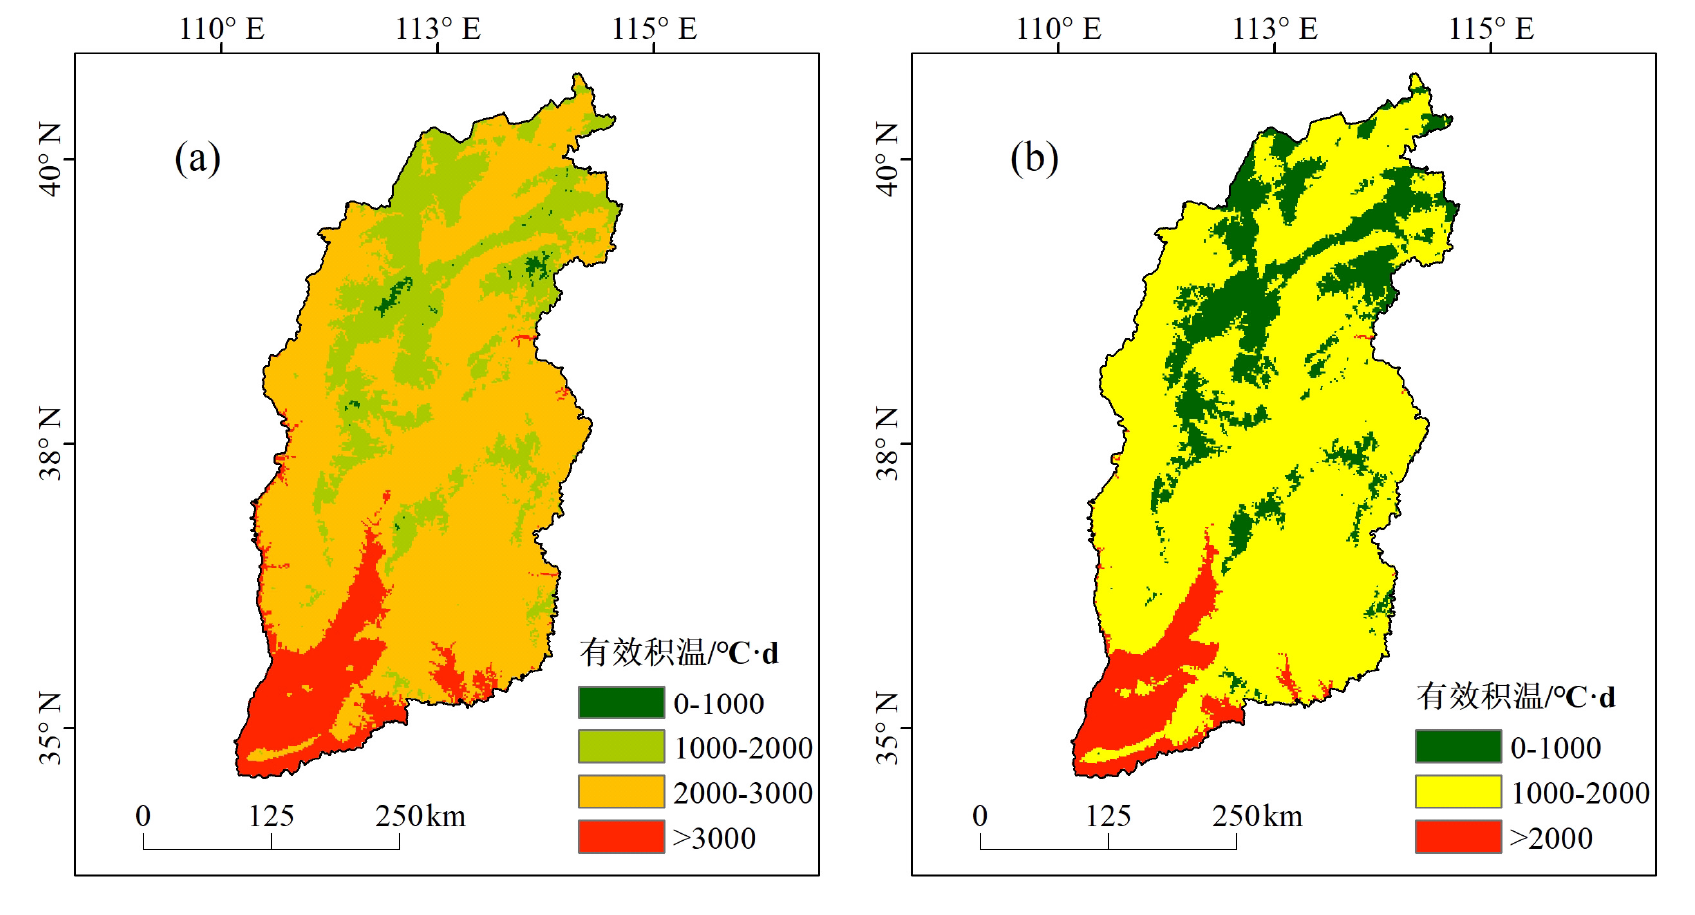
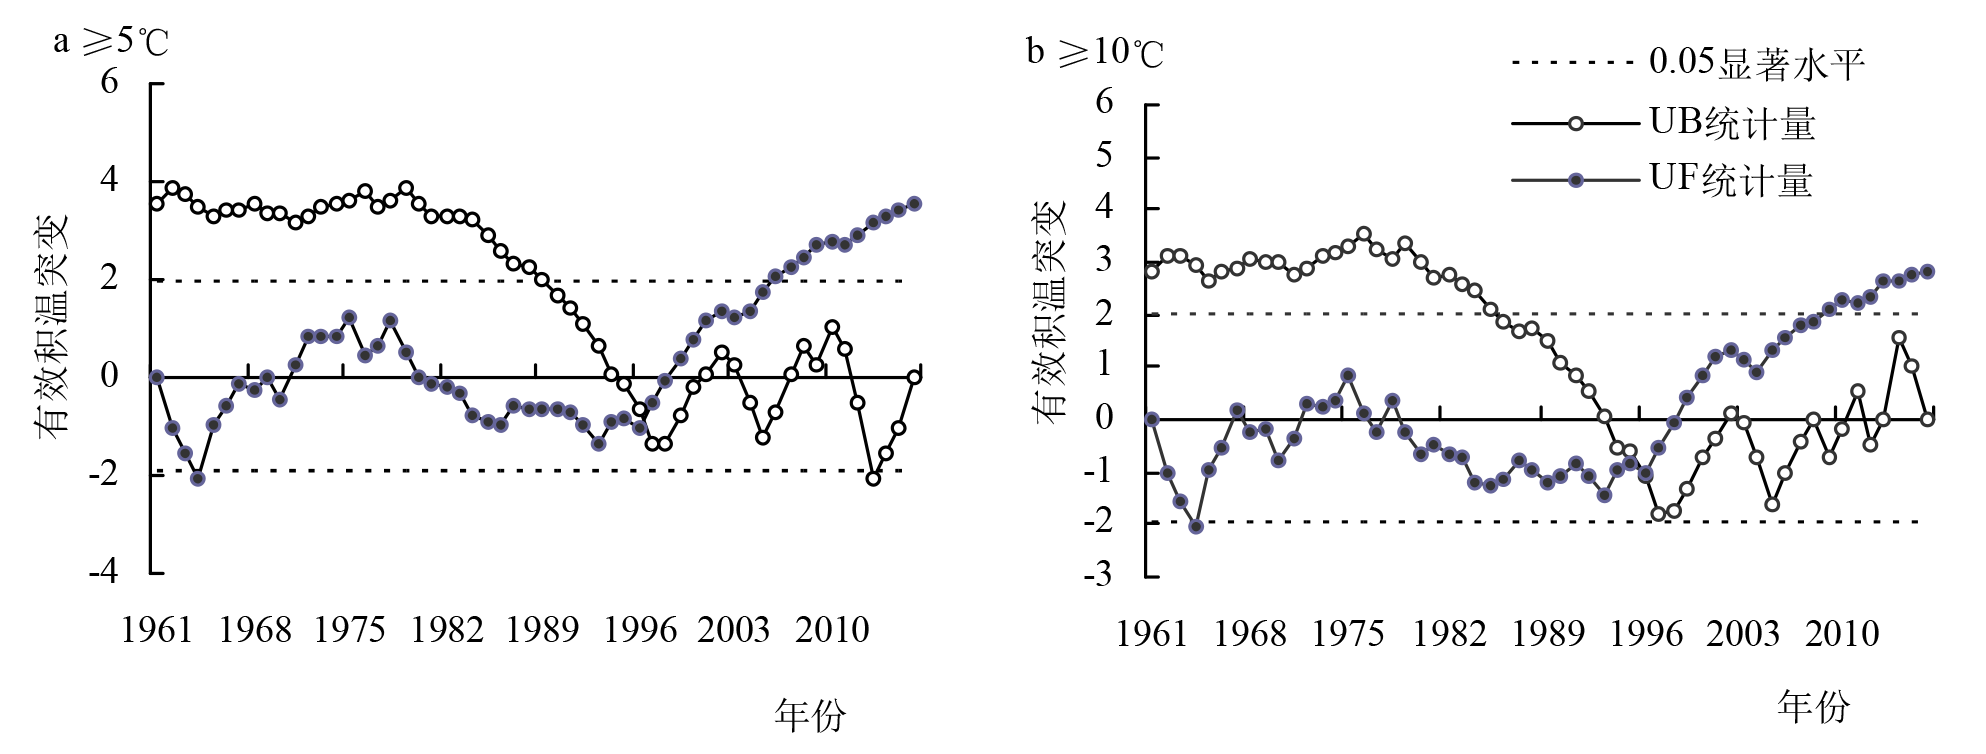
李帅, 张勃, 马彬, 等. 基于格点数据的中国1961—2016年≥5℃、≥10℃有效积温时空演变[J]. 自然资源学报, 2020, 35(5):1216-1227.
doi: 10.31497/zrzyxb.20200516
|
| [9] |
胡琦, 潘学标, 邵长秀, 等. 1961—2010年中国农业热量资源分布和变化特征[J]. 中国农业气象, 2014, 35(2):119-127.
|
| [10] |
杨晓光, 李勇, 代姝玮, 等. 气候变化背景下中国农业气候资源变化Ⅸ.中国农业气候资源时空变化特征[J]. 应用生态学报, 2011, 22(12):3177-3188.
|
| [11] |
姜树坤, 王立志, 杨贤莉, 等. 1961-2019年松嫩平原盐碱地区域水稻生长季气候资源的时空变化特征分析[J]. 作物杂志, 2022(6):9-15.
|
| [12] |
王贺然, 刘东明, 陈鹏狮, 等. 基于积温带重新划分的东北玉米熟型分布研究[J]. 中国农业资源与区划, 2022, 43(5):102-112.
|
| [13] |
赵济, 方修琦, 王卫. 新编中国自然地理[M]. 北京: 高等教育出版社, 2015.
|
| [14] |
戴声佩, 李海亮, 罗红霞, 等. 基于多元线性回归模型的华南地区≥10℃积温空间模拟研究[J]. 热带农业科学, 2014, 34(6):54-59.
|
| [15] |
马彬. 1960-2015年中国极端干旱区干湿变化及成因分析[D]. 兰州: 西北师范大学, 2017.
|
 ), LI Shuai2(