欢迎访问《中国农学通报》,
中国农学通报 ›› 2023, Vol. 39 ›› Issue (1): 123-132.doi: 10.11924/j.issn.1000-6850.casb2021-1212
马元花1,2( ), 印彩霞1, 王红玉1, 刘宇轩1, 刘前通1, 张泽1()
收稿日期:2021-12-28
修回日期:2022-11-10
出版日期:2023-01-05
发布日期:2022-12-27
通讯作者:
张泽
作者简介:马元花,女,1999年出生,新疆人,硕士,研究方向为作物信息技术与精准栽培。通信地址:712100 陕西杨凌邰城路3号 西北农林科技大学农学院,E-mail:基金资助:
MA Yuanhua1,2(), YIN Caixia1, WANG Hongyu1, LIU Yuxuan1, LIU Qiantong1, ZHANG Ze1()
Received:2021-12-28
Revised:2022-11-10
Online:2023-01-05
Published:2022-12-27
Contact:
ZHANG Ze
摘要:
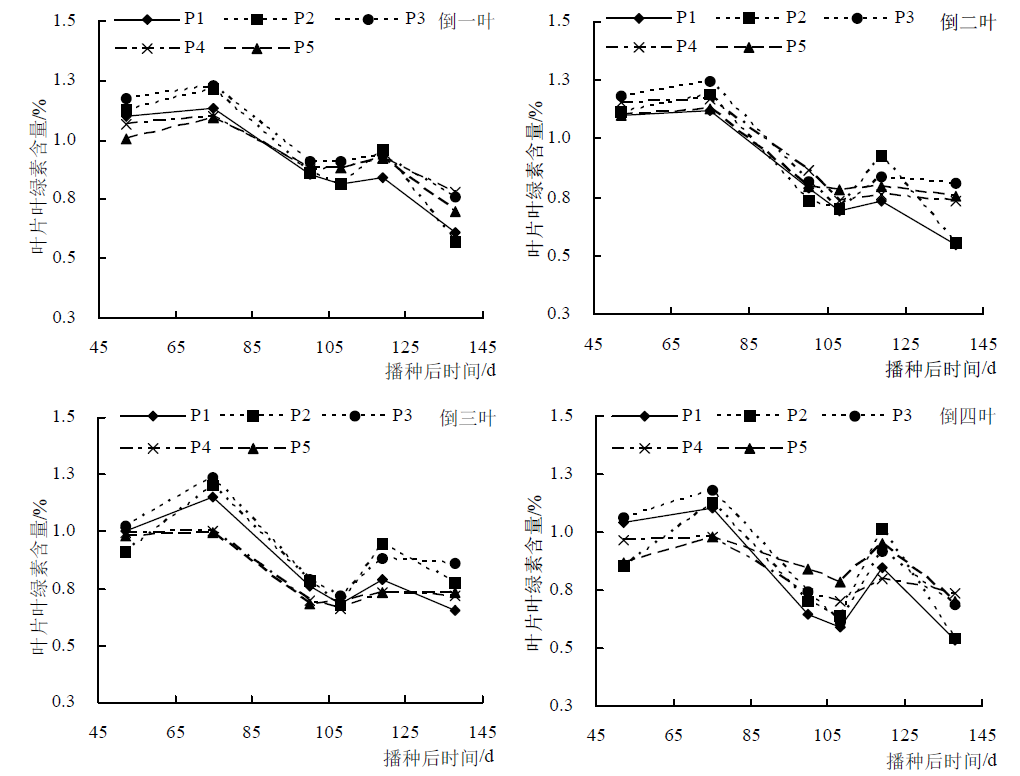
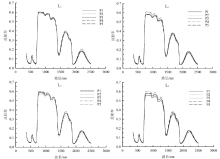
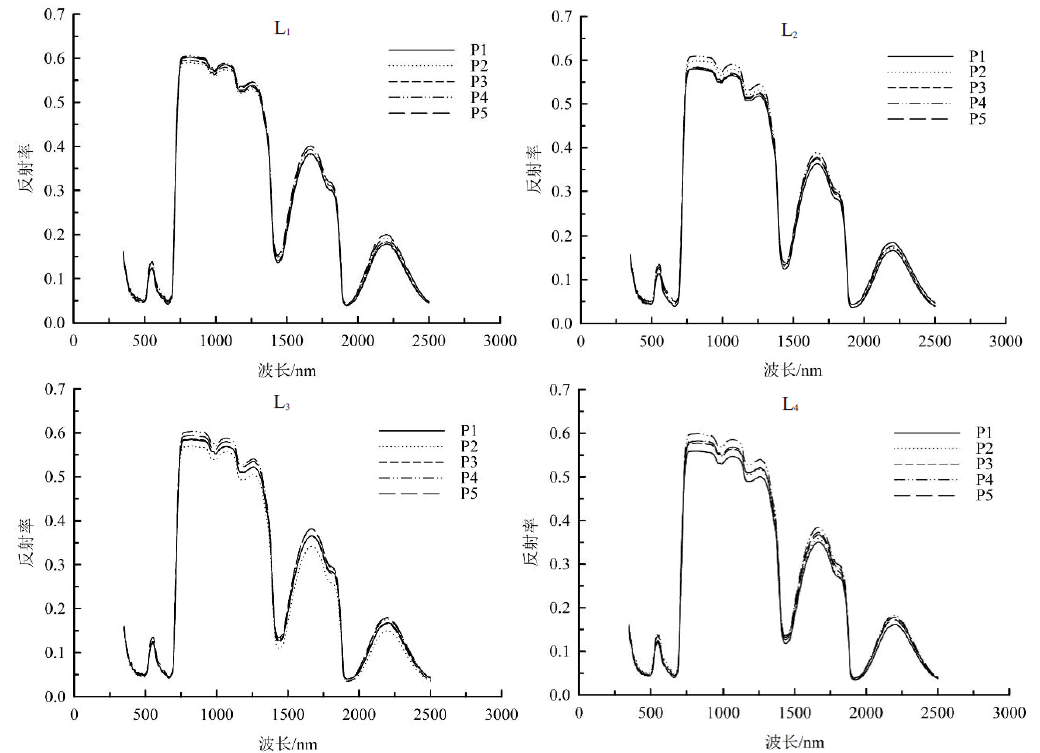
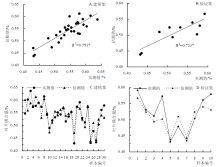
研究不同施磷条件下棉花叶片叶绿素含量的变化规律,旨在建立基于高光谱的叶片磷含量估测模型,实现棉花叶片磷含量快速监测。在盆栽试验条件下,设置不同的磷肥量,测定棉花功能叶叶绿素含量与磷含量,并利用植被指数和叶绿素含量的相关性构建磷含量的光谱变量,从而实现利用高光谱对棉花叶片磷含量的定量监测。结果表明:(1)棉花播种后100天左右,叶片磷含量与叶绿素呈现显著关系(决定系数R2=0.96)。(2)利用多个植被指数(X)和叶绿素含量(I)的相关性构建倒一叶、倒二叶、倒三叶、倒四叶的磷含量光谱变量,其中各叶片相关性最优的模型:倒一叶(L1)为I1=2.6131XRENDVI-0.4275,XRENDV为红边归一化植被指数,R2=0.71,RMSE=0.2;倒二叶(L2)为I5=0.0142XTVI+0.3274,XTVI为三角植被指数,R2=0.76,RMSE=0.09;倒三叶(L3)为I9=-0.3445XARI+0.4996,XARI为花青素反射指数,R2=0.47,RMSE=0.15;倒四叶(L4)为I10=-0.5082XARI+0.3484,R2=0.82,RMSE=0.10。(3)构建基于磷含量光谱变量的高光谱棉花叶片磷含量反演模型,模型R2、RMSE分别达0.75、0.04。因此,基于不同叶位的叶片植被指数和叶绿素含量的相关性,以及叶绿素含量和叶片磷含量的线性关系,可以实现高光谱对棉花叶片磷含量的有效估测。
马元花, 印彩霞, 王红玉, 刘宇轩, 刘前通, 张泽. 基于高光谱的棉花叶片磷含量估测模型[J]. 中国农学通报, 2023, 39(1): 123-132.
MA Yuanhua, YIN Caixia, WANG Hongyu, LIU Yuxuan, LIU Qiantong, ZHANG Ze. Estimation Model of Cotton Leaf Phosphorus Content Based on Hyperspectral Reflectance[J]. Chinese Agricultural Science Bulletin, 2023, 39(1): 123-132.
| 营养元素 | 盐类 | 相对分子质量 | 母液浓度/ (mmol/L) | 母液浓度/ (g/L) | 每升最终营养液中母液用量/ mL | 营养元素 | 营养液中元素最终浓度/ (μmol/L) |
|---|---|---|---|---|---|---|---|
| 大量营养元素 | KNO3 | 101.1 | 1000 | 101.1 | 6 | N、K | 16000 |
| Ca(NO3)2·4H2O | 236.16 | 1000 | 236.16 | 4 | Ca | 6000 | |
| NH4H2PO4 | 115.08 | 1000 | 115.08 | 2 | P | 4000 | |
| MgSO4·7H2O | 246.48 | 1000 | 246.48 | 1 | S、Mg | 2000 | |
| S | 1000 | ||||||
| Mg | 1000 | ||||||
| 微量营养元素 | KCl* | 74.55 | 25 | 1.864 | 2 | Cl | 50 |
| H3BO3 | 61.83 | 12.5 | 0.7773 | 2 | B | 25 | |
| MnSO4·H2O | 169.01 | 1 | 0.169 | 2 | Mn | 2 | |
| ZnSO4·H2O | 287.54 | 1 | 0.288 | 2 | Zn | 2 | |
| CuSO4·5H2O | 249.68 | 0.25 | 0.062 | 2 | Cu | 0.5 | |
| H2MoO4 | 161.97 | 0.25 | 0.04 | 2 | Mo | 0.5 | |
| NaFeDTPA | 558.5 | 64 | 30 | 0.3~1.0 | Fe | 16~53 | |
| NiSO4·6H2O* | 262.86 | 0.25 | 0.066 | 2 | Ni | 0.5 | |
| NaSiO3·9H2O* | 284.20 | 1000 | 284.2 | 1 | Si | 1000 |
| 植被指数 | 定义或计算公式 | 文献 |
|---|---|---|
| 比值植被指数1(RVI) | R765/R720 | [ |
| 归一化植被指数(NDVI) | (R800-R670)/(R800+R670) | [ |
| 大气阻抗植被指数(ARVI) | (R800-R670)/(R800+R670-R450) | [ |
| 红边归一化植被指数(RENDVI) | (R750-R705)/(R750+R705). | [ |
| 绿色归一化植被指数(GNDVI) | (R801-R550)/(R801+R550) | [ |
| 简单比值植被指数(GRVI) | R800/R550 | |
| 色素吸收比值植被指数(MRESR) | (R750-R445)/(R705+R445) | [ |
| 花青素反射指数(ARI) | (1/R550)-(l/R700) | [ |
| 比值植被指数2(MACI) | RNIR/Rgreen | |
| 比值植被指数3(ACI) | Rgreen/RNIR | |
| 三角植被指数(TVI) | 60×(R800-R550)-100×(R670-R550) | [ |
| MERIS陆地叶绿素指数(MTCI) | (R754-R709)/(R709-R681) | [ |

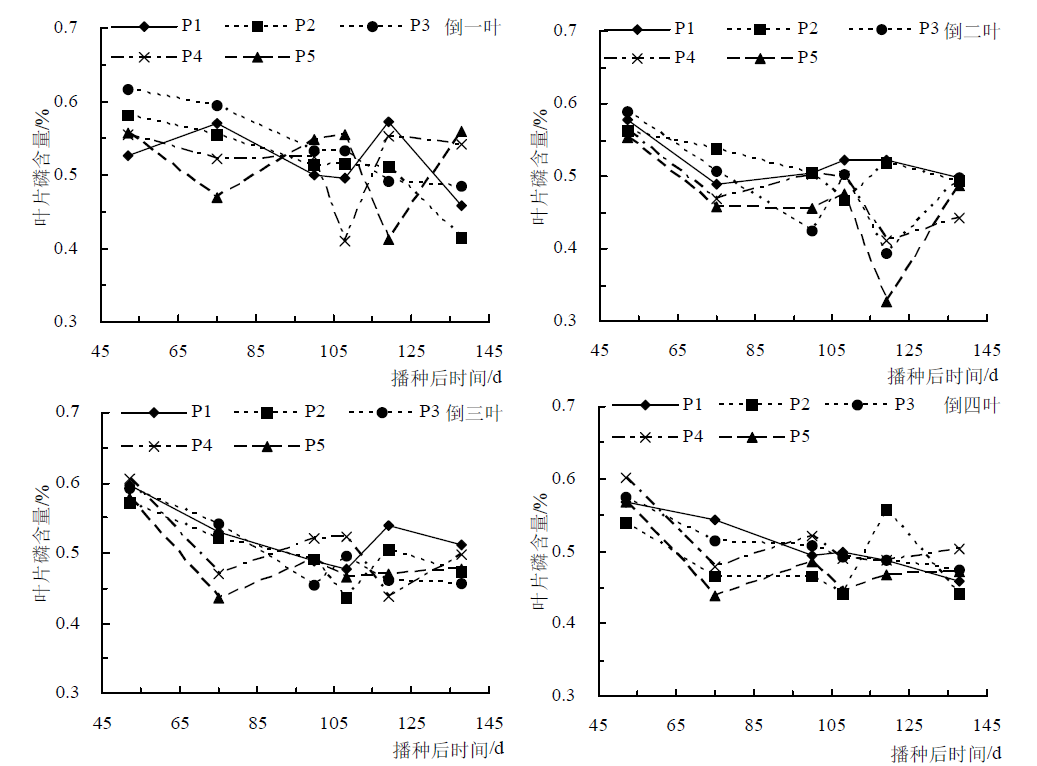
| 播种后时间/d | 回归关系 | R2 | RMSE |
|---|---|---|---|
| 52 | y=0.0585x+0.9238 | 0.00 | 0.09 |
| 75 | y=1.1019x+0.4775 | 0.42 | 0.06 |
| 100 | y=3.8246x-1.3455 | 0.96 | 0.01 |
| 108 | y=0.2748x+0.841 | 0.06 | 0.36 |
| 119 | y=0.2342x+1.0471 | 0.11 | 0.29 |
| 138 | y=1.1678x+0.1286 | 0.33 | 0.15 |
| 播种后时间/d | 回归关系 | R2 | RMSE |
|---|---|---|---|
| 52 | y=0.0585x+0.9238 | 0.00 | 0.09 |
| 75 | y=1.1019x+0.4775 | 0.42 | 0.06 |
| 100 | y=3.8246x-1.3455 | 0.96 | 0.01 |
| 108 | y=0.2748x+0.841 | 0.06 | 0.36 |
| 119 | y=0.2342x+1.0471 | 0.11 | 0.29 |
| 138 | y=1.1678x+0.1286 | 0.33 | 0.15 |


| 植被指数 | 倒一叶(L1) | 倒二叶(L2) | 倒三叶(L3) | 倒四叶(L4) |
|---|---|---|---|---|
| RVI | 0.43* | 0.38* | 0.26 | 0.34 |
| NDVI | 0.37* | 0.23 | -0.02 | 0.39* |
| ARVI | 0.33 | 0.16 | -0.01 | 0.41* |
| RENDVI | 0.50** | 0.38* | 0.26 | 0.45* |
| GNDVI | 0.49** | 0.33 | 0.18 | 0.36 |
| MRESR | 0.46* | 0.39* | 0.17 | 0.41* |
| ARI | -0.37* | -0.34 | -0.27 | -0.75** |
| MACI | 0.47** | 0.39* | 0.19 | 0.35 |
| GRVI | 0.47** | 0.39* | 0.19 | 0.35 |
| TVI | 0.29 | 0.39* | 0.27 | 0.14 |
| ACI | -0.49** | -0.32 | -0.18 | -0.36 |
| MTCI | 0.47** | 0.41* | 0.32 | 0.38* |
| 叶位 | 植被指数 | 模型 | R2 | RMSE |
|---|---|---|---|---|
| 倒一叶(L1) | RENDVI | I1=2.6131XRENDVI-0.4275 | 0.71** | 0.20 |
| ACI | I2=-2.9647XACI+1.6231 | 0.68** | 0.10 | |
| GNDVI | I3=2.4568XGNDVI-0.5752 | 0.53* | 0.14 | |
| 倒二叶(L2) | MTCI | I4=0.5019XMTCI-0.1767 | 0.48* | 0.16 |
| TVI | I5=0.0142XTVI+0.3274 | 0.76** | 0.09 | |
| MRESR | I6=0.3531XMRESR+0.0399 | 0.47* | 0.17 | |
| 倒三叶(L3) | VOG1 | I7=1.0585XMTCI-0.6708 | 0.19 | 0.19 |
| RENDVI | I8=2.2098XRENDVI-0.3241 | 0.27 | 0.18 | |
| ARI | I9=-0.3445XARI+0.4996 | 0.47 | 0.15 | |
| 倒四叶(L4) | ARI | I10=-0.5082XARI+0.3484 | 0.82** | 0.10 |
| RENDVI | I11=3.8056XRENDVI-1.1886 | 0.74** | 0.09 | |
| ARVI | I12=15.5320XARVI-13.6220 | 0.58* | 0.17 |

| [1] | 张继澍. 植物生理学[M]. 北京: 高等教育出版社, 2006:68-69. |
| [2] | 董文. 施肥水平对湖南春马铃薯生长、产量及养分积累与分配的影响[D]. 长沙: 湖南农业大学, 2018. |
| [3] | 陈国兴. 磷素营养水平对大豆光合作用及磷素吸收积累的影响[D]. 哈尔滨: 东北农业大学, 2017. |
| [4] | 李俊峰. 不同水稻品种对低磷响应的差异及其生理机制[D]. 扬州: 扬州大学, 2018. |
| [5] |
LIU C, LIU W, CHEN W, et al. Feasibility in multispectral imaging for predicting the content of bioactive compounds in intact tomato fruit[J]. Food chemistry, 2015, 173:482-488.
doi: 10.1016/j.foodchem.2014.10.052 pmid: 25466049 |
| [6] |
PU Y, ZHAO M, COLM O’Donnell, et al. Nondestructive quality evaluation of banana slices during microwave vacuum drying using spectral and imaging techniques[J]. Drying technology, 2018, 36(13):1542-1553.
doi: 10.1080/07373937.2017.1415929 URL |
| [7] | SHARMA S, PRADHAN R, MANICKAVASAGAN A, et al. Characterization of ultrasonic-treated corn crop biomass using imaging, spectral and thermal techniques: A review[J]. Biomass conversion and biorefinery, 2020(10). |
| [8] | 孙红, 郑涛, 刘宁, 等. 高光谱图像检测马铃薯植株叶绿素含量垂直分布[J]. 农业工程学报, 2018, 34(1):149-156. |
| [9] | 裴浩杰, 冯海宽, 李长春, 等. 基于多元线性回归和随机森林的苹果叶绿素含量高光谱估测方法比较[J]. 江苏农业科学, 2018, 46(17):224-230. |
| [10] | 李美清, 李晋阳, 毛罕平. 基于光谱特征和生理特征的番茄磷营养诊断方法[J]. 农业机械学报, 2016, 47(3):286-291. |
| [11] | 刘红玉, 毛罕平, 朱文静, 等. 基于高光谱的番茄氮磷钾营养水平快速诊断[J]. 农业工程学报, 2015, 31(S1):212-220. |
| [12] | 梁颖, 石玉, 靳琇, 等. 低磷胁迫下光质对番茄幼苗生长及生理抗性的影响[J]. 中国农学通报, 2020, 36(1):56-61. |
| [13] | 师祖姣. 旱作冬小麦氮磷配施增产效应与氮磷营养遥感诊断研究[D]. 杨凌: 西北农林科技大学, 2018. |
| [14] | 毕银丽, 孙江涛, YPYSZHAN Z, 等. 不同施磷水平下接种菌根玉米营养状况及光谱特征分析[J]. 煤炭学报, 2016, 41(5):1227-1235. |
| [15] | 程一松, 胡春胜, 王成, 等. 养分胁迫下的夏玉米生理反应与光谱特征[J]. 资源科学, 2001(6):54-58. |
| [16] | 郭曼, 常庆瑞, 张连民, 等. 关中地区不同营养状况冬小麦光谱特性初探[J]. 干旱地区农业研究, 2006(3):49-53. |
| [17] | 贺佳, 刘冰锋, 李军, 等. 不同生育时期冬小麦叶面积指数高光谱遥感监测模型[J]. 农业工程学报, 2014, 30(24):141-150. |
| [18] | 王磊, 白由路, 杨俐苹, 等. 春玉米磷素营养的光谱响应及诊断[J]. 植物营养与肥料学报, 2007(5):802-808. |
| [19] | 任红艳, 潘剑君, 张佳宝, 等. 不同磷肥水平的小麦冠层多光谱特征研究[J]. 土壤, 2005(4):405-409. |
| [20] | PEARSON R L, MILLER L D. Remote mapping of standing crop biomass for estimation of the productivity of the shortgrass prairie[A]. // Proceedings of the 8th International Symposium on Remote Sensing of Environment[C]. Ann Arbor, Michigan, USA, 1972:1357-1381. |
| [21] | ROUSE J, HAAS R H, DEERING D, et al. Monitoring the vernal advancement and retrogradation (green wave effect) of natural vegetation: NASA/GSFCT Type III Final Report[R]. USA: NASA/GSFCT, 1973. |
| [22] |
HUETE A, JUSTICE C, LIU H. Development of vegetation and soil indices for MODIS-EOS[J]. Remote sensing of environment, 1994, 49(3):224-234.
doi: 10.1016/0034-4257(94)90018-3 URL |
| [23] |
GITELSON A, MERZLYAK M N. Quantitative estimation of chlorophyll-a using reflectance spectra: Experiments with autumn chestnut and maple leaves[J]. Journal of photochemistry and photobiology B: Biology, 1994, 22(3):247-252.
doi: 10.1016/1011-1344(93)06963-4 URL |
| [24] |
GITELSON A A, KAUFMAN Y J, STARK R, et al. Novel algorithms for remote estimation of vegetation fraction[J]. Remote sensing of environment, 2002, 80(1):76-87.
doi: 10.1016/S0034-4257(01)00289-9 URL |
| [25] |
SIMS D A, GAMON J A. Relationships between leaf pigment content and spectral reflectance across a wide range of species, leaf structures and developmental stages[J]. Remote sensing of environment, 2002, 81(2-3):337-354.
doi: 10.1016/S0034-4257(02)00010-X URL |
| [26] |
GITELSON A A, MERZLYAK M N, CHIVKUNOVA O B. Optical properties and nondestructive estimation of anthocyanin content in plant leaves[J]. Photochemistry and photobiology, 2001, 74(1):38-45.
pmid: 11460535 |
| [27] |
BROGE N H, LEBLANC E. Comparing prediction power and stability of broadband and hyperspectral vegetation indices for estimation of green leaf area index and canopy chlorophyll density[J]. Remote sensing of environment, 2003, 76(2):156-172.
doi: 10.1016/S0034-4257(00)00197-8 URL |
| [28] |
DASH J, CURRAN P J. The MERIS terrestrial chlorophyll index[J]. International journal of remote sensing, 2004, 25(23):5403-5413.
doi: 10.1080/0143116042000274015 URL |
| [29] | 张卓然. 棉花高光谱特征及其农学参数遥感反演研究[D]. 杨凌: 西北农林科技大学, 2018. |
| [30] | 贾良良, 陈新平, 张福锁, 等. 作物氮营养诊断的无损测试技术[J]. 世界农业, 2001(6):36-37. |
| [31] |
李宗飞, 苏继霞, 费聪, 等. 基于高光谱数据的滴灌甜菜叶片全氮含量估算[J]. 作物学报, 2020, 46(4):557-570.
doi: 10.3724/SP.J.1006.2020.94045 |
| [32] | 王赏贵, 李新疆, 费浩, 等. 基于高光谱的棉花叶片氮素检测[J]. 科技创新与应用, 2020(3):17-19. |
| [33] | 刘爽, 于海业, 陈美辰, 等. 大豆不同水氮胁迫响应规律的高光谱分析[J]. 光谱学与光谱分析, 2020, 40(5):1575-1580. |
| [34] | 杨海波, 李斐, 张加康, 等. 基于高光谱指数估测马铃薯植株氮素浓度的敏感波段提取[J]. 植物营养与肥料学报, 2020, 26(3):541-551. |
| [35] | 王烁, 常庆瑞, 刘梦云, 等. 基于高光谱遥感的棉花叶片叶绿素含量估算[J]. 中国农业大学学报, 2017, 22(4):16-27. |
| [36] | 王纪华, 黄文江, 赵春江, 等. 利用光谱反射率估算叶片生化组分和籽粒品质指标研究[J]. 遥感学报, 2003(4):277-284. |
| [37] | 杨福芹, 冯海宽, 李振海, 等. 基于可见光-近红外光谱特征参数的苹果叶片氮含量预测[J]. 农业机械学报, 2017, 48(9):143-151. |
| [38] | 王甲辰, 梁丽娜, 王学霞, 等. 基于高光谱的夏玉米氮含量及产量估测模型[J]. 江苏农业科学, 2020, 48(23):227-233. |
| [39] |
PINAR A, CURRAN P J. Technical note grass chlorophyll and the reflectance red edge[J]. International journal of remote sensing, 1996, 17(2):351-357.
doi: 10.1080/01431169608949010 URL |
| [40] | 马文君, 常庆瑞, 田明璐, 等. 棉花全生育期叶片SPAD值的遥感估算模型[J]. 干旱地区农业研究, 2017, 35(5):42-48. |
| [41] | 林芬芳, 丁晓东, 付志鹏, 等. 基于互信息理论的水稻磷素营养高光谱诊断[J]. 光谱学与光谱分析, 2009, 29(9):2467-2470. |
| [42] | 张浩, 胡昊, 陈义, 等. 水稻叶片氮素及籽粒蛋白质含量的高光谱估测模型[J]. 核农学报, 2012, 26(1):135-140. |
| [43] | 李旭青, 刘湘南, 刘美玲, 等. 水稻冠层氮素含量光谱反演的随机森林算法及区域应用[J]. 遥感学报, 2014, 18(4):923-945. |
| [44] |
杨福芹, 冯海宽, 李振海, 等. 基于高光谱的苹果叶片叶绿素含量估算[J]. 浙江农业学报, 2017, 29(10):1742-1748.
doi: 10.3969/j.issn.1004-1524.2017.10.21 |
| [45] | 韩兆迎, 朱西存, 王凌, 等. 基于连续统去除法的苹果树冠SPAD高光谱估测[J]. 激光与光电子学进展, 2016, 53(2):220-229. |
| [46] | 刘冰峰, 李军, 贺佳, 等. 玉米叶片全磷含量高光谱遥感监测诊断模型研究[J]. 农业机械学报, 2015, 46(8):252-258,280. |
| [1] | 苟纪权, 苏丽文, 程志魁, 黄小春, 吴雯婷, 吕海旋, 刘政国. 冬瓜果肉叶绿素含量遗传分析[J]. 中国农学通报, 2023, 39(1): 45-50. |
| [2] | 洪波, 张泽, 张强, 马怡茹, 易翔, 吕新. 基于数码图像的棉花叶片氮含量估测研究[J]. 中国农学通报, 2022, 38(9): 49-55. |
| [3] | 周先林, 覃琴, 孟永明, 王龙, 胡成成, 朱海勇, 赖波. 不同改良剂对新疆盐碱土壤改良及棉花生长的影响[J]. 中国农学通报, 2022, 38(34): 91-96. |
| [4] | 赵佼娇, 哀建国. 杉木幼苗光合及叶绿素荧光特征对氮沉降的短期响应[J]. 中国农学通报, 2022, 38(29): 67-73. |
| [5] | 陈敏敏, 聂功平, 李心, 周琳, 杨柳燕, 张永春. 自然高温条件下百合叶绿素荧光特性分析[J]. 中国农学通报, 2022, 38(29): 86-95. |
| [6] | 梁培鑫, 唐榕, 郭晨荔, 郭睿, 何皇成, 王腾飞, 刘建国. 油莎豆对自然盐碱胁迫的生长及生理响应[J]. 中国农学通报, 2022, 38(26): 1-8. |
| [7] | 宋钊, 梁栌丹, 黄文茵, 陈潇, 曹健, 何裕志, 张白鸽. 涝渍胁迫下辣椒叶绿素含量与SPAD值相关性模型建立及应用[J]. 中国农学通报, 2022, 38(25): 30-37. |
| [8] | 侯俊峰, 陈斌, 包斐, 谭禾平, 韩海亮, 王桂跃, 赵福成. 秸混肥不同处理对‘浙甜19’生长特性和产量的影响[J]. 中国农学通报, 2022, 38(23): 6-14. |
| [9] | 连晓倩, 陶长铸, 郭昊澜, 李娜娜, 曹越, 吴鹏飞. 光照对芦苇生物生产力及光合能力的影响[J]. 中国农学通报, 2022, 38(20): 47-52. |
| [10] | 郭燕云, 王雪姣, 王森, 火勋国, 胡启瑞, 吉春容. 新疆棉花物候期对气候变化的响应及敏感性分析[J]. 中国农学通报, 2022, 38(18): 113-121. |
| [11] | 于博, 张学芳, 徐松鹤, 任琴, 杨玉亭, 周萌洋, 潘瑜, 刘梦琪. 配方施肥对春玉米生长发育的影响[J]. 中国农学通报, 2022, 38(17): 10-16. |
| [12] | 赵如皓, 丁俊男, 于少鹏, 王慧, 史传奇, 张志, 孟博. NaCl胁迫对野生大豆幼苗生理及叶绿素荧光特性的影响[J]. 中国农学通报, 2022, 38(14): 23-29. |
| [13] | 王贵平, 薛晓敏, 赵红强, 陈汝, 韩雪平, 王金政. ‘富士’苹果不套袋与套袋密度对树体光合特性的影响[J]. 中国农学通报, 2022, 38(13): 54-59. |
| [14] | 徐敏, 金路路, 孙丽园, 李瑞春, 王子胜. 棉花化学脱叶剂在辽河流域棉区的应用效果研究[J]. 中国农学通报, 2022, 38(12): 47-54. |
| [15] | 尹国, 路正营, 孙璐, 张彦波, 李世云. 金花葵染色体倍性分析及属间远缘杂交研究[J]. 中国农学通报, 2021, 37(9): 16-21. |
| 阅读次数 | ||||||
|
全文 |
|
|||||
|
摘要 |
|
|||||