Welcome to Chinese Agricultural Science Bulletin,
Chinese Agricultural Science Bulletin ›› 2022, Vol. 38 ›› Issue (2): 141-149.doi: 10.11924/j.issn.1000-6850.casb2021-0119
Special Issue: 现代农业发展与乡村振兴; 畜牧兽医
Previous Articles Next Articles
WANG Xuejiao( ), LI Longwei(), DU Chunyan
Received:2021-02-02
Revised:2021-08-17
Online:2022-01-15
Published:2022-02-25
Contact:
LI Longwei
E-mail:wang1986_xuejiao@163.com;532492334@qq.com
CLC Number:
WANG Xuejiao, LI Longwei, DU Chunyan. Status Quo and Comparative Advantages of Mutton Sheep Industry in Yunnan Province[J]. Chinese Agricultural Science Bulletin, 2022, 38(2): 141-149.
Add to citation manager EndNote|Ris|BibTeX
URL: https://www.casb.org.cn/EN/10.11924/j.issn.1000-6850.casb2021-0119
| 年份 | 全国 | 云南 | 云南占全国比重/% | ||||||||
|---|---|---|---|---|---|---|---|---|---|---|---|
| 存栏量/ 万只 | 年出栏量/ 万只 | 羊肉产量/ 万t | 存栏量/ 万只 | 年出栏量/ 万只 | 羊肉产量/ 万t | 存栏量 | 年出栏量 | 羊肉产量 | |||
| 2008 | 28084.90 | 26172.30 | 380.30 | 843.30 | 651.90 | 11.50 | 3.00 | 2.49 | 3.02 | ||
| 2009 | 28452.20 | 26732.90 | 389.40 | 877.60 | 687.10 | 12.10 | 3.08 | 2.57 | 3.11 | ||
| 2010 | 28087.90 | 27220.20 | 398.90 | 877.90 | 730.20 | 12.90 | 3.13 | 2.68 | 3.23 | ||
| 2011 | 28235.80 | 26661.50 | 393.10 | 900.90 | 735.50 | 13.00 | 3.19 | 2.76 | 3.31 | ||
| 2012 | 28504.10 | 27099.60 | 401.00 | 913.50 | 767.10 | 13.60 | 3.20 | 2.83 | 3.39 | ||
| 2013 | 29036.30 | 27586.80 | 408.10 | 929.10 | 792.40 | 14.00 | 3.20 | 2.87 | 3.43 | ||
| 2014 | 30314.90 | 28741.60 | 428.20 | 1008.00 | 807.10 | 14.60 | 3.33 | 2.81 | 3.41 | ||
| 2015 | 31099.70 | 29472.70 | 440.80 | 1057.40 | 854.70 | 15.00 | 3.40 | 2.90 | 3.40 | ||
| 2016 | 30112.00 | 30694.60 | 459.40 | 1043.70 | 871.60 | 15.10 | 3.47 | 2.84 | 3.29 | ||
| 2017 | 30231.70 | 30797.70 | 471.10 | 1240.20 | 1024.10 | 18.10 | 4.10 | 3.33 | 3.84 | ||
| 2018 | 29713.50 | 31010.50 | 475.10 | 1268.90 | 1051.50 | 18.60 | 4.27 | 3.39 | 3.91 | ||
| 2019 | 30072.10 | 31698.90 | 487.50 | 1307.00 | 1137.20 | 20.00 | 4.35 | 3.59 | 4.10 | ||


| 年份 | 全国出口量/t | 全国出口额/万美元 | 云南出口量/t | 云南出口额/万美元 |
|---|---|---|---|---|
| 2009 | 9532.00 | 4176.10 | 8.0 | 4.4 |
| 2010 | 13481.00 | 6897.70 | 38.0 | 29.0 |
| 2011 | 8118.00 | 5304.60 | 49.0 | 44.5 |
| 2012 | 5043.00 | 4251.00 | 50.0 | 50.0 |
| 2013 | 3214.00 | 3134.90 | 27.0 | 30.2 |
| 2018 | 3401.29 | 3429.04 | 186.0 | 159.4 |
| 2019 | 2046.00 | 2210.02 | 83.5 | 77.4 |
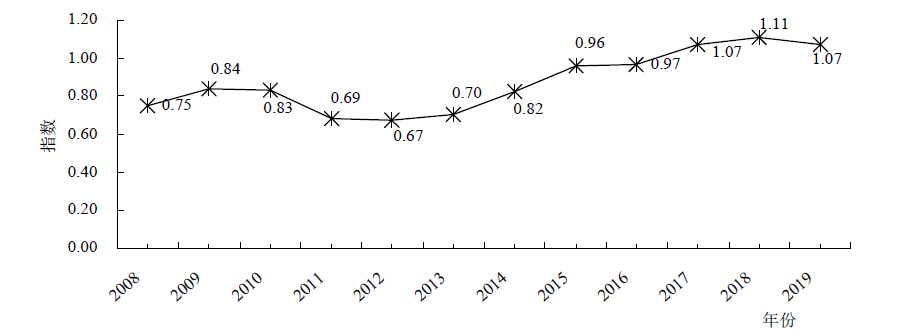
| 年份 | 云南肉羊产值/亿元 | 云南生产总值/亿元 | 全国肉羊产值/亿元 | 全国国内生产总值/亿元 | 云南比例/% | 全国比例/% | 区位商/% |
|---|---|---|---|---|---|---|---|
| 2008 | 22.30 | 5692.12 | 1084.50 | 319244.60 | 0.39 | 0.34 | 1.15 |
| 2009 | 28.00 | 6169.75 | 1181.70 | 348517.70 | 0.45 | 0.34 | 1.34 |
| 2010 | 30.30 | 7224.18 | 1399.50 | 412119.30 | 0.42 | 0.34 | 1.24 |
| 2011 | 33.30 | 8893.12 | 1713.20 | 487940.20 | 0.37 | 0.35 | 1.07 |
| 2012 | 40.50 | 10309.47 | 2010.00 | 538580.00 | 0.39 | 0.37 | 1.05 |
| 2013 | 50.80 | 11832.31 | 2294.70 | 592963.20 | 0.43 | 0.39 | 1.11 |
| 2014 | 62.60 | 12814.59 | 2377.70 | 641280.60 | 0.49 | 0.37 | 1.32 |
| 2015 | 63.10 | 13619.17 | 2086.90 | 685992.90 | 0.46 | 0.30 | 1.52 |
| 2016 | 66.70 | 14788.42 | 2131.80 | 740060.80 | 0.45 | 0.29 | 1.57 |
| 2017 | 87.80 | 16376.34 | 2309.90 | 820754.30 | 0.54 | 0.28 | 1.91 |
| 2018 | 103.10 | 17881.12 | 2574.40 | 900309.50 | 0.58 | 0.29 | 2.02 |
| 2019 | 126.90 | 23223.75 | 2973.70 | 990865.10 | 0.55 | 0.30 | 1.82 |

| 地区 | 2013 | 2014 | 2015 | 2016 | 2017 | 2018 | 2019 | 7年间增长率/% |
|---|---|---|---|---|---|---|---|---|
| 昆明 | 0.70 | 0.66 | 0.60 | 0.59 | 0.62 | 0.61 | 0.57 | -18.60 |
| 曲靖 | 2.24 | 2.26 | 2.23 | 2.25 | 2.19 | 2.27 | 2.08 | -7.15 |
| 玉溪 | 0.72 | 0.71 | 0.73 | 0.76 | 0.79 | 0.82 | 0.74 | 3.22 |
| 保山 | 0.92 | 0.88 | 1.04 | 1.06 | 1.11 | 1.12 | 1.05 | 14.45 |
| 昭通 | 0.41 | 0.40 | 0.42 | 0.42 | 0.42 | 0.44 | 0.41 | -1.18 |
| 丽江 | 1.61 | 1.71 | 1.75 | 1.63 | 1.68 | 1.87 | 1.88 | 16.82 |
| 普洱 | 0.32 | 0.37 | 0.40 | 0.45 | 0.44 | 0.49 | 0.47 | 43.19 |
| 临沧 | 0.74 | 0.74 | 0.76 | 0.75 | 0.73 | 0.79 | 0.75 | 2.28 |
| 楚雄 | 1.57 | 1.56 | 1.56 | 1.49 | 1.50 | 1.78 | 1.72 | 9.44 |
| 红河 | 0.63 | 0.77 | 0.69 | 0.69 | 0.70 | 0.76 | 0.79 | 25.71 |
| 文山 | 0.54 | 0.52 | 0.58 | 0.60 | 0.57 | 0.67 | 0.63 | 16.76 |
| 西双版纳 | 0.02 | 0.03 | 0.03 | 0.04 | 0.05 | 0.06 | 0.06 | 180.46 |
| 大理 | 2.00 | 1.90 | 1.93 | 1.89 | 1.87 | 2.04 | 1.81 | -9.40 |
| 德宏 | 0.27 | 0.26 | 0.29 | 0.30 | 0.31 | 0.32 | 0.30 | 10.82 |
| 怒江 | 1.96 | 1.93 | 1.66 | 1.91 | 1.93 | 1.95 | 1.96 | 0.33 |
| 迪庆 | 0.83 | 0.81 | 0.93 | 0.88 | 0.89 | 0.90 | 0.87 | 5.47 |
| [1] | 何昌胜. 临夏县肉羊产业发展的思考[J]. 畜牧兽医科技信息, 2021(5):102-103. |
| [2] | 李军, 金海. 2020年我国肉羊产业发展概况、未来发展趋势及建议[J]. 中国畜牧杂志, 2021(3):223-228. |
| [3] | 赵有璋. 中国肉羊产业发展趋势、存在主要问题和建议对策[J]. 现代畜牧兽医, 2020(1):54-57. |
| [4] | 张英杰. 我国羊产业发展形势分析[J]. 饲料工业, 2020(21):1-4. |
| [5] | 邵俊杰, 许朗. 江苏省肉羊产业发展现状、问题及对策[J]. 中国畜牧杂志, 2018(5):145-149. |
| [6] | 赵钰洁, 韩振兴, 姚晓萍. 山西省肉羊产业发展现状及存在问题分析[J]. 黑龙江畜牧兽医, 2020(20):21-23. |
| [7] | 刘玉凤, 王明利. 基于因子分析法的中国肉羊产业优势省区研究[J]. 中国农学通报, 2015, 31(5):12-19. |
| [8] | 王士权, 王文义, 常倩, 等. 中国肉羊主产区比较优势分析[J]. 中国畜牧杂志, 2015, 51(22):3-9. |
| [9] | 马志超, 张立中. 中国西部省区肉羊产业比较优势研究[J]. 黑龙江畜牧兽医, 2019(20):10-14. |
| [10] | 吴清秀, 高爽, 王桂霞. 少数民族地区畜禽产品比较优势与专业化生产分析[J]. 中国畜牧杂志, 2014, 50(16):28-32. |
| [11] | 蒲子雯. 基于比较优势的山东省肉羊产业发展形势与竞争力分析[J]. 安徽农学通报, 2021(3):58-61. |
| [12] | 赵大军, 修长百. “稳羊增牛扩猪禽”战略降低了内蒙古肉羊产业的比较优势吗?[J]. 内蒙古社会科学:汉文版, 2019(2):198-203. |
| [13] | 马丽荣, 赵有彪, 李珂璟, 等. 基于比较优势理论的甘肃省肉羊生产区域结构研究[J]. 甘肃农业科技, 2017(11):30-33. |
| [14] | 张宗领. 曲靖市肉羊养殖现状及养殖技术措施[J]. 中国畜牧兽医文摘, 2015(9):86-86. |
| [15] | 张丽春, 赵天永, 李丽红. 红河州草食畜牧业生产现状及对策[J]. 中国草食动物科学, 2014(2):61-63. |
| [16] | 王瑞欣, 王秋燕, 孙利民, 等. 新常态下云南肉羊产业发展思考[J]. 云南畜牧兽医, 2017(6):18-21. |
| [17] | 王娟, 吴晶, 信爱国, 等. 云南省肉羊养殖、消费与品牌建设现状分析[J]. 中国草食动物科学, 2019(6):61-63. |
| [18] | 陈甜. 中国绒毛用羊生产比较优势与区域布局研究[D]. 北京:中国农业大学, 2015. |
| [19] | 杨钰泽, 贾悦, 李滢. 基于比较优势法对河北省蔬菜产业的分析[J]. 蔬菜, 2021(1):58-63. |
| [20] | 钟瑶. 湖北省农业区域专业化水平测度及影响因素分析[D]. 武汉:华中师范大学, 2018. |
| [1] | GAO Wei, ZHANG Jun, HAO Xi, LIU Juan, ZANG Xiuwang. Regional Change of Peanut Production in Henan Province [J]. Chinese Agricultural Science Bulletin, 2023, 39(1): 22-30. |
| [2] | WANG Xuejiao, LI Liang, MAO Zhaoqing, LI Longwei, CHEN Liangzheng. The Construction of Regional Grain Industry Chain and Supply Chain in Yunnan Province [J]. Chinese Agricultural Science Bulletin, 2022, 38(5): 157-164. |
| [3] | MA Yuemei, WANG Rongdang. Indexation Measurement of the Advantage of Main Grain Crops in Yunnan Province Based on the Comparative Advantage Theory [J]. Chinese Agricultural Science Bulletin, 2022, 38(30): 141-150. |
| [4] | LIU Jingyi, YUAN Ruixue, LIU Chenghan, SUI Yuzhu, CHEN Haipeng, SUN Yanchun. Status Quo and Prospect of Research on Botanical Insecticides Against Stored Grain Pests [J]. Chinese Agricultural Science Bulletin, 2022, 38(23): 121-128. |
| [5] | TANG Junchao, WU Yiwen, ZHANG Yao, CAO Qingsui, WU Zhaoxue, XIA Liru, BAO Encai. A Brief Introduction on the Industrial Development Mode of Photovoltaic Agriculture [J]. Chinese Agricultural Science Bulletin, 2022, 38(11): 144-152. |
| [6] | Wang Changliang, Zhao Lianfeng, Chang Jianzhi, Wei Shengli, Yan Lihui, Li Yanchang, Wang Hailiang. 80 Declassified American Maize Inbred Lines: Utilization Potential Analysis [J]. Chinese Agricultural Science Bulletin, 2021, 37(24): 25-30. |
| [7] | Shi Jin, Xu Guangcai. Study on Measurement of Industrial Agglomeration of Vegetable Specialized Villages in Beijing [J]. Chinese Agricultural Science Bulletin, 2021, 37(11): 158-164. |
| [8] | Yu Kai, Song Qianhong, Zhao Yongfeng. The Status Quo and Industrialization of Rice-aquaculture Integrated Cultivation in Jiangsu [J]. Chinese Agricultural Science Bulletin, 2020, 36(23): 161-164. |
| [9] | . Status Quo and Competitiveness of Agricultural Products Export in China [J]. Chinese Agricultural Science Bulletin, 2019, 35(9): 149-154. |
| [10] | . Comparative Advantage of Tropical Fruits in Hainan Based on Comparative Advantage Theory: Empirical Analysis [J]. Chinese Agricultural Science Bulletin, 2018, 34(5): 159-164. |
| [11] | . Income Report on Herdsmen in High Altitude Area: Taking Guoqing Village in Lhasa City as an Example [J]. Chinese Agricultural Science Bulletin, 2017, 33(8): 161-164. |
| [12] | Dong Xiaobo,Chen Liangzheng,Yang Maoqing,Peng Ziyun and Yuan Yuan. Comparative Advantage of Characteristic Agriculture in Yunnan Plateau [J]. Chinese Agricultural Science Bulletin, 2016, 32(12): 175-182. |
| [13] | . Comparative advantage of major agricultural Products in Sichuan [J]. Chinese Agricultural Science Bulletin, 2015, 31(3): 282-290. |
| [14] | 刘奇志. Status Quo and Prospects of Research and Industrial Development on Greater Wax Worm at Home and Abroad [J]. Chinese Agricultural Science Bulletin, 2015, 31(28): 280-284. |
| [15] | . Analysis of Comparative Advantage of the Main Aquaculture Products in Bohai Rim [J]. Chinese Agricultural Science Bulletin, 2014, 30(32): 48-53. |
| Viewed | ||||||
|
Full text |
|
|||||
|
Abstract |
|
|||||